
2013 Ratings Update: Bristol through Dover
[NOTE: The attendance model will be released next week. I'm putting the final touches on it right now. Does the economy control most of the flow of in-race fans? What about gas prices? Does track configuration play much of a role? I'm really excited to unveil this censored regression model. Also, he probably doesn't read this; but I want to thank Marty Reid for thirty-one years of motorsports coverage on ESPN. I grew-up watching him cover SODA races from Crandon, truck races in Portland, and countless other quirky events. I always enjoyed his style and wish him the best of luck.]
The last several Cup races have produced a high degree of intrigue. The race to get into the “Chase” involved some popular drivers, there was controversy at Richmond, and a veteran came-out of the playoff gates swinging (Matt Kenseth is a veteran and that makes me feel old). This brief analysis gauges the overall interest from the past few races in NASCAR’s top series via television ratings.
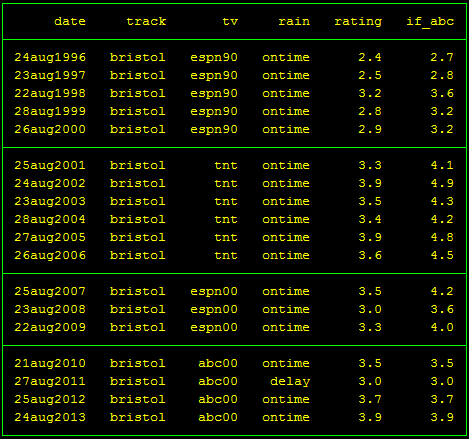
The Saturday night event at Bristol drew a 3.9 household rating on ABC. The high tally garnered praise because it matched the best-ever audience size in the history of the traditional night race in Tennessee. But further analysis shows that much of the good news was driven by the race’s airing on ABC instead of cable television. The column labeled as “rating” shows the actual rating for the Bristol night race, while the variable named “if_abc” adjusts the rating for each year as if it were broadcast on ABC:
 After taking into account which channel aired the race, the 3.9 that this year’s edition pulled is more comparable to its recent historical records. The following graph depicts these “network-adjusted” ratings for the Bristol night race from 1996 through 2013:
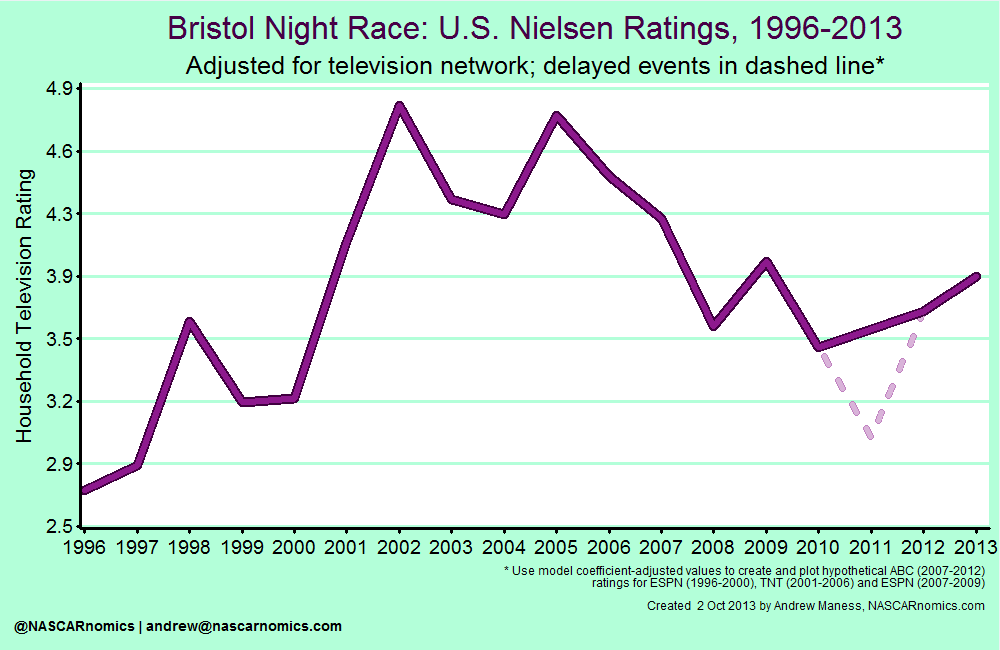 Even though the television success of the 2013 Bristol night race is a bit dulled after the network-adjustment, the 3.9 remains impressive relative to the past five years of the annual event. Additionally, that rating ranks above all Bristol night races before the consolidate schedule era; that is, the 3.9 beats any household audience from 1996 through 2000.
NASCAR made its Labor Day weekend trip to Atlanta Motor Speedway at the beginning of September. I have numbers for this event from 1994 through 2013. I plot the network-adjusted household ratings in the following chart:
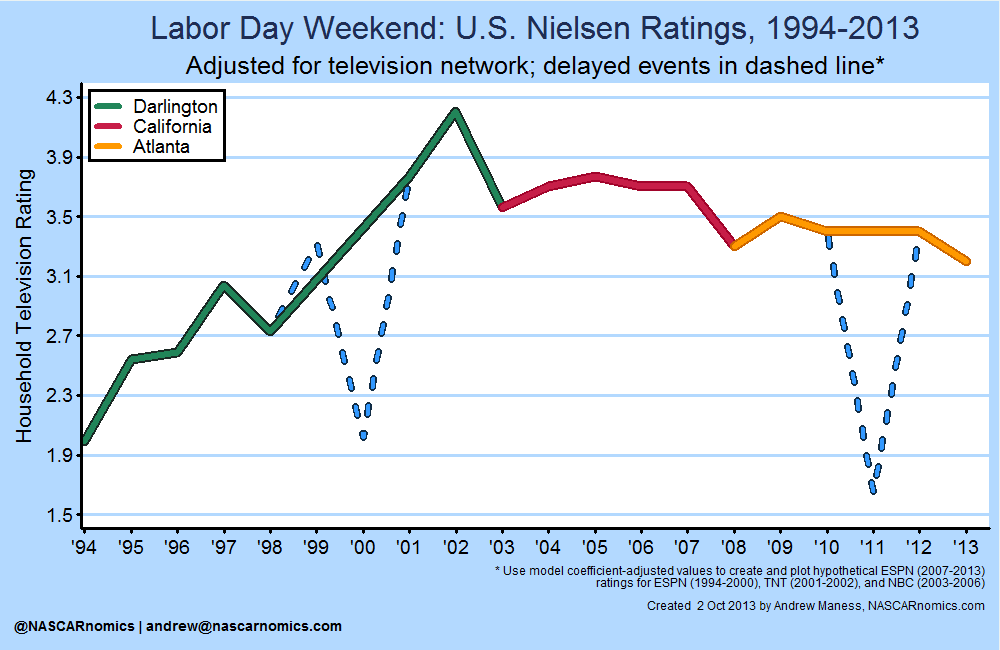 From a research standpoint, the Labor Day weekend race is intriguing because it is a case study of switching tracks on a landmark race-date. The traditional Southern 500 rode the “boom” that NASCAR absorbed in the late 1990s and early 2000s. After the race performed somewhat poorly in 2003, NASCAR assigned the coveted date to Fontana (colored in red). When Auto Club Speedway had the weekend’s events, the ratings performed below expectations. This was concerning; while NASCAR continued expanding its television audience in the mid-2000s, the new weekend tradition lagged. Moving the Sunday night event to a historical race-track in Atlanta mitigated a lot of the lost audience. Once again, the Labor Day classic has become a key event on the Cup Series’ schedule.
The last several races have earned television ratings that are largely predictable. Despite the number of teams vying for a Chase slot, Richmond’s household audience decreased from its last on-time race in 2011. Chicagoland — an event that many were forecasting an above-average rating due to certain “things” — was marred by rain. Nonetheless, its 2.4 rating for what amounted to be a round-table discussion with interviews is outstanding. Loudon and Dover inched above last year’s 2.2s, which were the two of the four lowest-rated events since 1995:
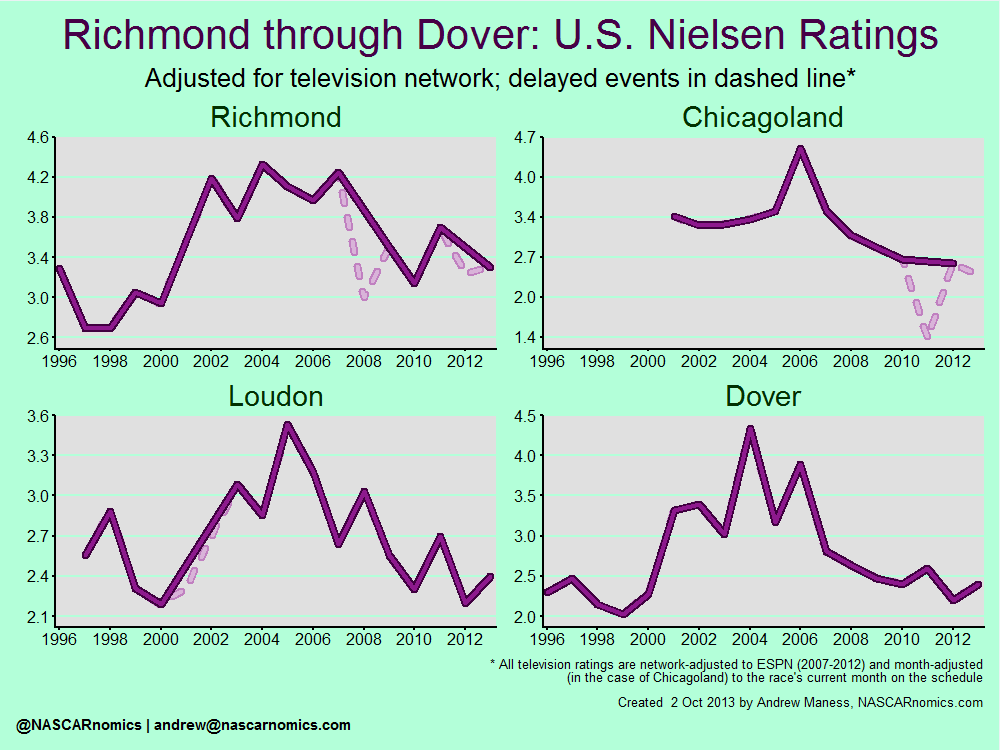 So let’s take a look at the year-to-date television ratings and how they fall-in to historical expectations. The pink line represents the predicted household rating by taking into account a number of event characteristics. The colored dot is the actual rating that the race earned. A green dot means that the coverage drew an audience within reasonable expectations, while a brown mark shows a race that was postponed:
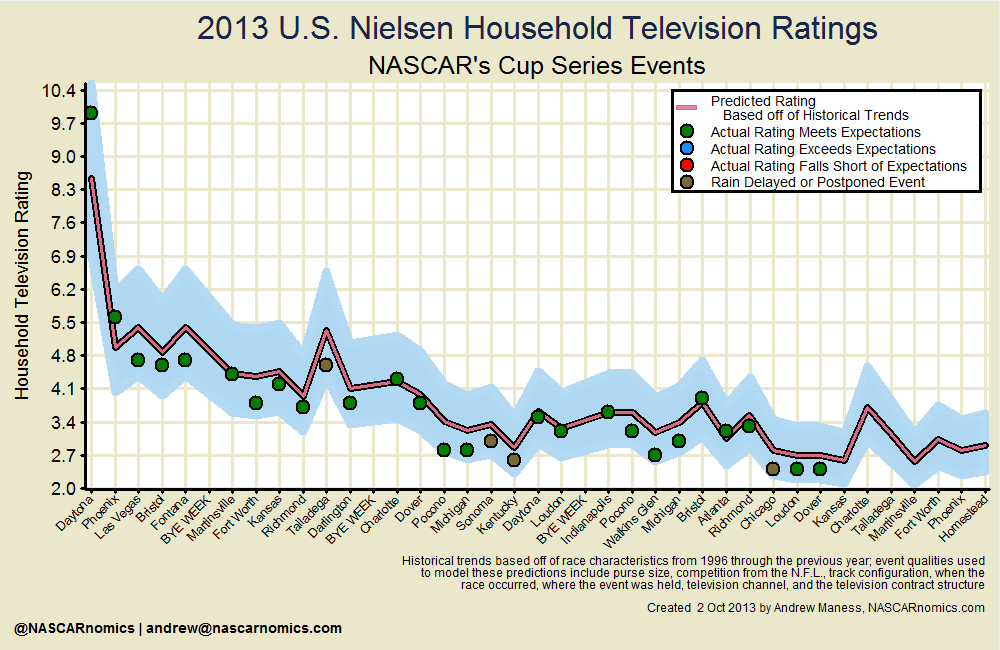
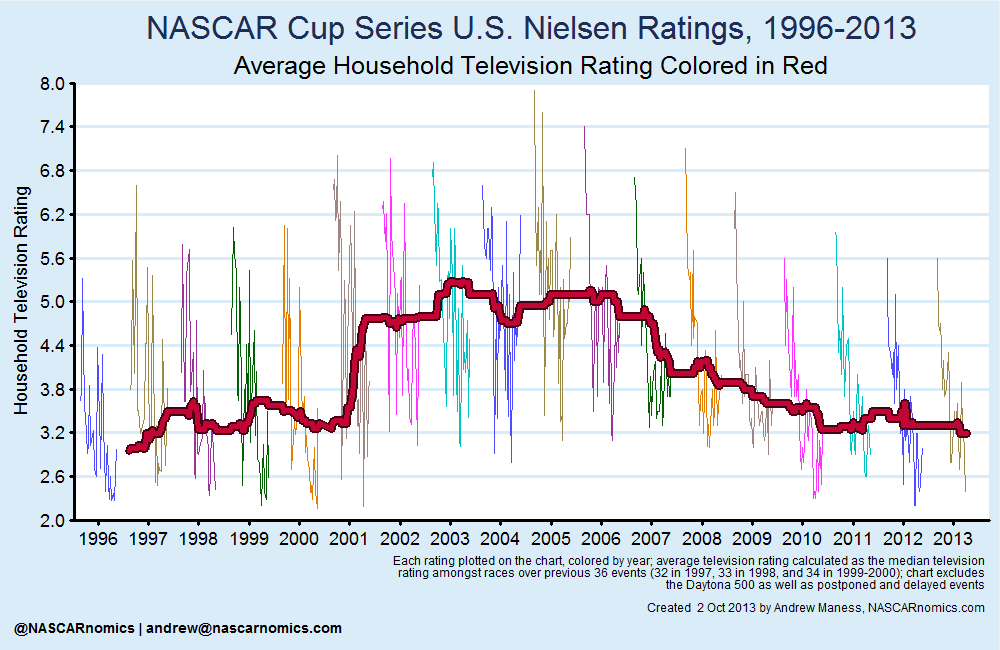
NASCAR’s top series has remained flat or insignificantly down for the balance of the season. Most impressive is ESPN and ABC’s coverage. Despite its status as an outgoing rights-holder (which normally leads to a 6% reduction in the household television rating), the networks have largely met expectations of overall audience size. Finally, the average historical television rating has steadily clocked-in at a 3.2 for the last several weeks. Like previous rights-transfers, I expect this value to decline a bit if TNT, ABC, and ESPN stick around for 2014:
 And there’s my brief analysis for television ratings from September. I’ll unveil my attendance model next week. It should shed some light as to how much the economy influences folks in the stands. As always, if you have questions, please reach-out to me on Twitter at or send me deeper thoughts via electonic mail at .