
On IndyCar Ratings…
I recently shared a graph which charts the television ratings for INDYCAR’s IndyCar Series from 1996 through today. I plotted each race’s U.S. Nielsen rating and calculated the one-year moving average for the series’ household audience:
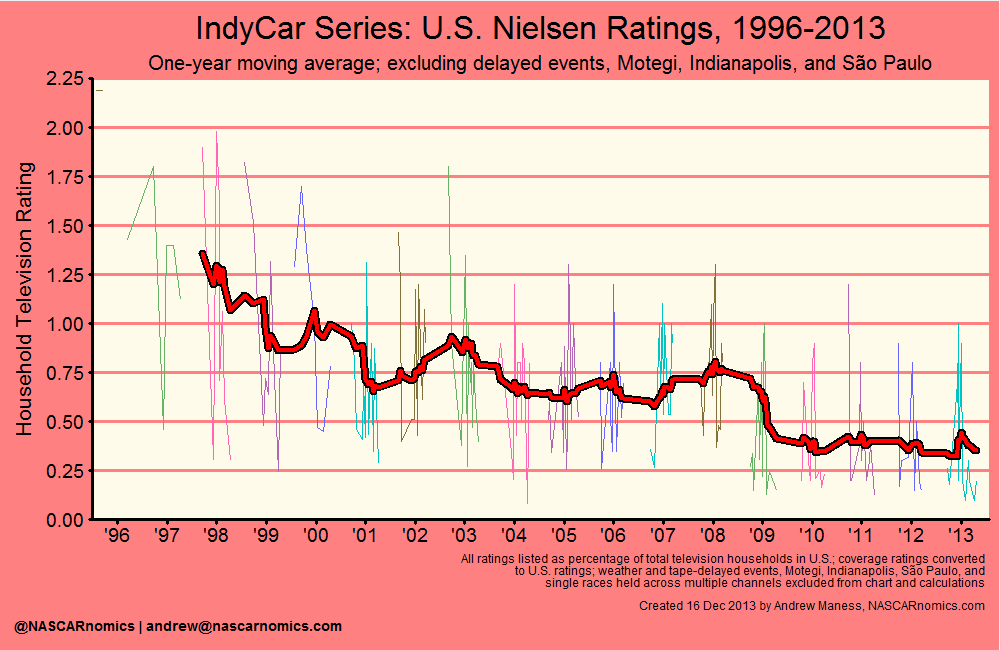
The series’ popularity on television displays a downward trend for much of its history, while the last four seasons with ABC and NBC Sports Network (NBCSN, née Versus) have been relatively flat. In this entry, I quantify characteristics that impel IndyCar’s household audience size. Furthermore, I develop an elegant regression model that explains over 91% of the movement in television ratings for the IndyCar Series. Regression analysis helps one understand how television ratings adjust when a key characteristic (e.g., time of year, television network, track configuration, competition from NASCAR, etc.) changes, while holding equal all other influential factors.
This particular analysis is a new exercise for open-wheel racing research. Though thoughtful examinations on the topic have occurred, my study is the first to empirically distinguish the components that drive ratings.
I incorporate 12 characteristics of IndyCar events and explain over 91% of the audience differentiation across the entire sample. To estimate, I collect a rich dataset of all 254 IndyCar Series races’ U.S. Nielsen television ratings from 1996 through 2013. I exclude 13 events which aired outside of United States time zones; additionally, I remove from the analysis 26 races that were delayed or postponed. In total, I model 215 events to determine which characteristics affect household audience sizes for open-wheel racing’s top series. I post the following results and explain the meaning of them directly below the table:
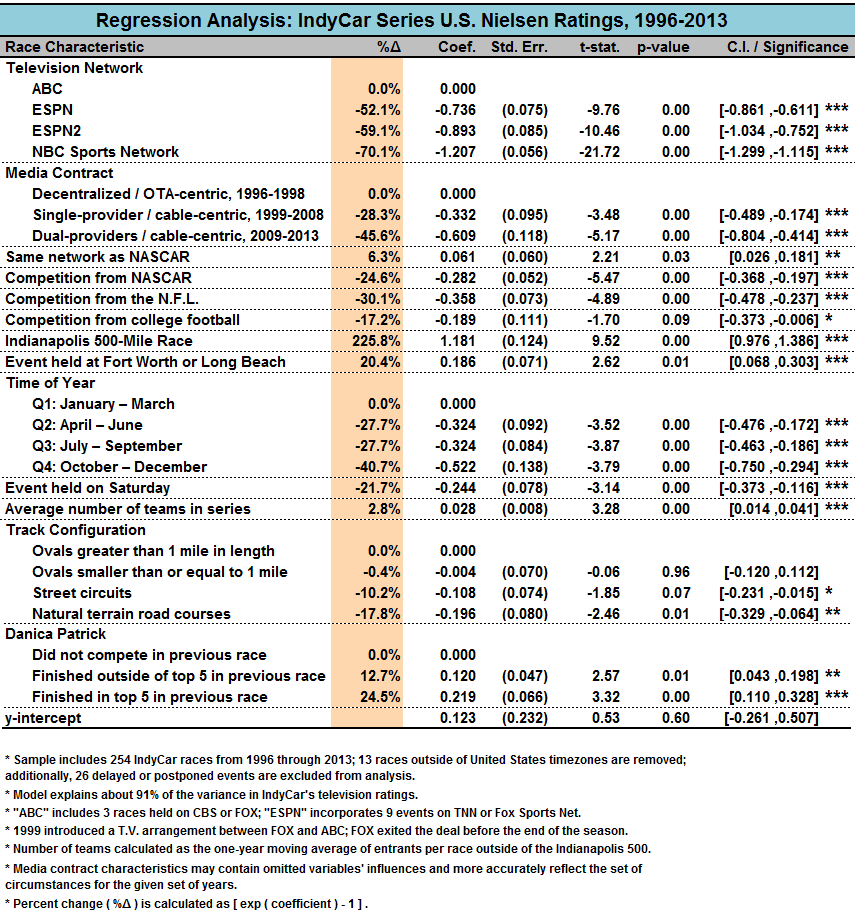
Each category is distinguished by a dotted line. I list each race characteristic followed by its percent impact on television ratings. The subsequent columns display measurements and diagnostics that determine the significance of the variable analyzed. I construct the model for easy interpretation without sacrificing its explanatory power — you may inspect the tan-shaded percent change column (“%Δ”) for the impact that the characteristic has on television ratings.
I also share a table (the link in this sentence) that explains the meaning of each term in English — you might find this easier to digest. Here are some key findings:
- Races earn household audiences that are roughly 6% larger when airing on networks that hold a major contract with NASCAR. As such, IndyCar should expect an augmented number of viewers when NASCAR enters NBCSN’s line-up in 2015. Interestingly enough, however, when an IndyCar race airs directly opposite of a Cup Series event; the open-wheel series loses a quarter of its typical audience. Events also suffer significantly when competing for viewers with the NFL and college football (30% and 17%, respectively).
- Oval facilities listed as one-mile or greater in length earn the highest television ratings among track configurations, all other variables held constant. Shorter ovals draw a similar audience, while street and road courses result in ratings reductions of 10% and 18%, respectively. An event held on a street circuit that draws a 0.2 television rating, for example, would increase to 0.3 (depending on rounding) if the race were held on a large oval, ceteris paribus.
- IndyCar events on NBCSN result in a 38% decrease in television ratings compared to a similar race on ESPN (an open-wheel partner from 1997 through 2008). To examine the relationship between current partners, a similar race on NBCSN reduces ratings by 70% compared to ABC.
- Ms. Danica Patrick’s presence in the IndyCar Series was meaningful. Her participation garnered home audiences that were 13% greater than events in which she did not appear. Ms. Patrick’s finishing in the top 5 resulted in a ratings boost of 25% for the following race, all other terms held equal.
Some characteristics are noticeably absent from my model. The number of American participants and the average experience and age of drivers (both throughout the field and among the top 8 in the season-long standings) demonstrate no impact on IndyCar’s television ratings. Similarly, night racing, the economy, and “schedule momentum” (airing consecutive weekly events on the same family of networks) hold no statistical influence on the series’ household audience size.
I can also examine some “what if” scenarios. In particular, I’m interested in how IndyCar’s ratings would fare if the series extended its contract with ABC/ESPN that expired in 2008. From my model, I note that ESPN drew ratings that were 38% larger than NBCSN’s, all other race characteristics held constant. Additionally, such a deal would have aligned IndyCar with “NASCAR on ESPN,” which historically leads to better ratings by 6%. I apply these “household audience premiums” to all of NBCSN’s telecasts and assume that the previous media deal were extended. The green dashed line exhibits what the ratings would look like under the specified scenario:
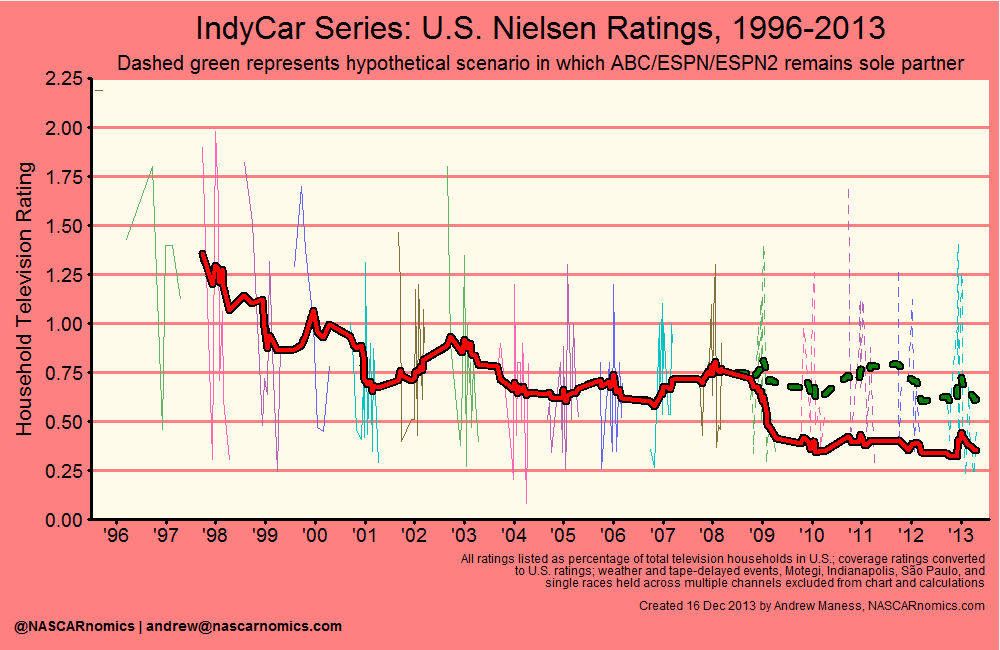
While this graph is counterfactual, it illustrates the impact of television network on IndyCar’s popularity. NBCSN is a relatively new network with low visibility compared to ESPN. NASCAR’s move to the channel should benefit IndyCar — after all, open-wheel racing’s following on television increases when the collaboration occurs. Simply adding a high-profile sport should increase the number of households equipped with the channel, too. This chart also allows the reader to view IndyCar’s popularity independent of television contracts. Under the scenario, the series steadily increased its audience through 2011, declined substantially in 2012, and increased a bit in 2013 before succumbing to a competitive fall schedule.
The point of this website is to correctly understand the past — a skill often forgotten in today’s society. Thus, I minimize policy suggestions; but I do have some questions for you. Will NASCAR encounter a smaller audience when switching to NBCSN, or will its presence elevate the entire channel’s visibility? What factors caused the decline to IndyCar’s popularity in 2012? How will the series’ condensed schedule for 2014 affect its television ratings? Might the Cup Series benefit as greatly if Danica Patrick can muster better finishes? How will ABC’s airing the majority of Indianapolis 500 activities affect the rest of the season? Is there anything else you’d like to add?
As always, I appreciate your taking the time to read this entry. I have loads of free time in the coming weeks, so please feel free to send me a note while I chip away at some more research. You may contact me on Twitter at or send me electronic mail at . Thanks!