
On Debris Cautions…
In motorsports, a yellow flag indicates that a hazard on the track exists. During that period, all teams must adhere to the sanctioning body’s caution rules to ensure safety while the hazard is removed. In recent years, NASCAR’s top series has exhibited an increased incidence of caution periods from debris on the racetrack. The purpose of this research is not to expose or debate the merits of debris cautions; rather, my objective is to analyze and confirm evidence of the behavior and predictability about these phenomena.
As a review (or more accurately, a shameless plug to my previous work), I concluded this summer that the expected number of wrecks in a race positively influences interest in NASCAR’s Cup Series. Additionally, I showed that yellow flags due to debris and other non-contact hazards have no effect on television ratings. They indirectly augment viewership, however, by breeding future incidents due to contact.
Here are the main points I discuss in this entry:
- The number of full-course cautions attributed to debris annually increased from 2000 through 2005 and remained elevated through 2013.
- Debris yellows are highly concentrated among ovals that are one-mile or larger in length (excluding restrictor-plate events).
- A green-flag run typically ends for debris immediately before or after the first set of green-flag pit-stops. If the green-flag run continues, the chance of a debris caution increases substantially half-way to the second round of pit-stops.
The following graph is straightforward. After adjusting for race-lengths due to shortened races and overtime periods, I calculate the average number of debris cautions per race from 1990 through 2013:
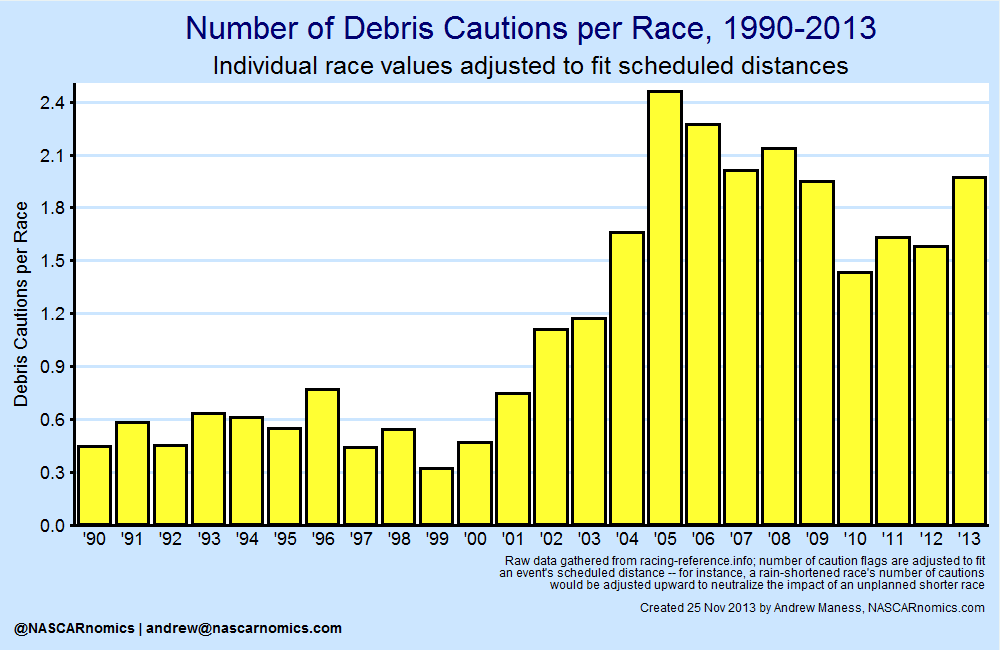
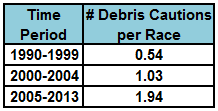
Three distinct trends appear above. Throughout the 1990s, cautions for debris were relatively sparse — a full-course yellow was prompted for debris once every two events. The frequency of them amplified, however, in the early 2000s. During that time, the average number of caution flags per race increased exponentially. By 2005, the sanctioning body waved the yellow flag for debris over two-and-a-half instances per race. The increasing trend slowed in the most recent decade, though the absolute number of debris cautions remained elevated. The following table lists the number of cautions from debris in three time periods:
I’m curious about the prefabrication of these values. In other words, what drives this elevated probability of NASCAR’s finding debris compared to the 1990s? Rather than speculate, I take a data-driven approach. I find that the brunt of this shift is found in oval tracks one-mile and larger. The following chart assesses the average number of debris cautions per race by track configuration:
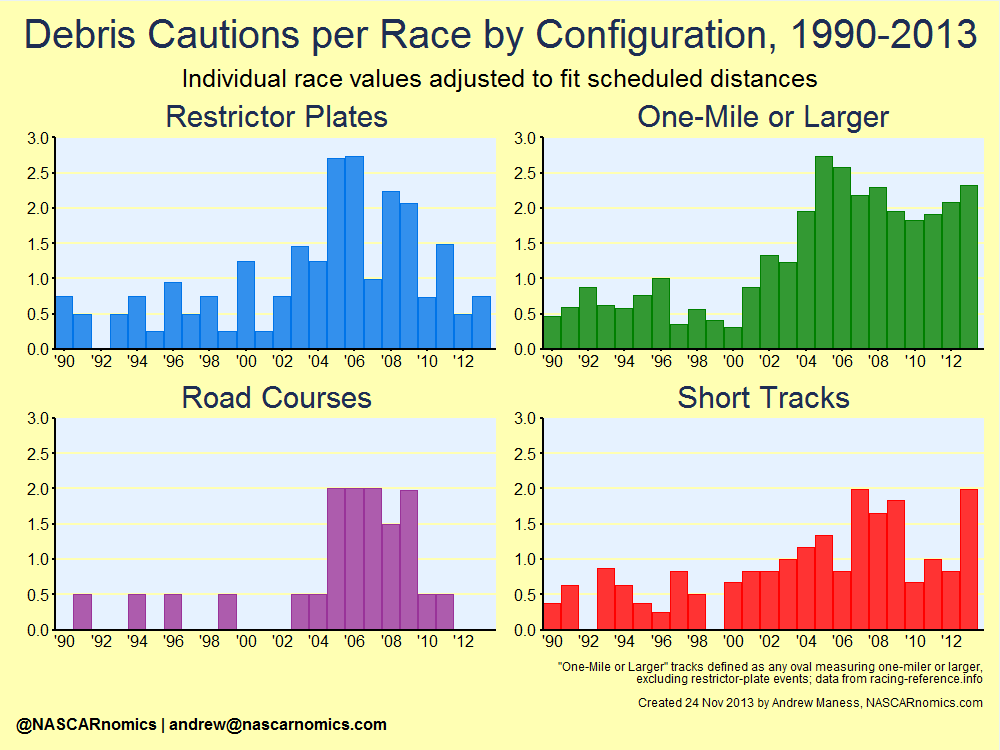
All types of tracks produced a heightened number of debris cautions in the mid-to-late 2000s, but the one-mile-plus ovals remained elevated through 2013. If one assumes that short tracks’ number of yellow flags from 2013 were an aberration, the chief culprit of the continuously elevated number of debris cautions are the aforementioned intermediate ovals. In fact, NASCAR has displayed the yellow flag for debris over 2.24 times per race on those configurations since 2004.
I examine whether a pattern to this type of yellow flag exists within each race. Specifically, I determine when debris cautions are called relative to re/starts from 2001 through 2013 for tracks one-mile or larger. By doing so, I can answer questions like, “What is the probability that a yellow-flag for debris occurs immediately after a round of green-flag pit-stops?”
An initial hurdle obstructs meaningful analysis — the pit-window itself. Within my sample, tracks vary in length and NASCAR’s designated fuel-cell capacity fluctuates from year-to-year (Mr. Dutton’s critiques are the best). To neutralize these components, I convert race laps into the number of full-fuel runs that compose a green-flag run for each track and each year.
For example, the pit-window at Texas Motor Speedway in 2012 was roughly 43 to 46 laps, so I assign 44.5 laps of a green-flag run to be one “full fuel-run” for that event. Therefore, its race-opening green-flag run of 100 laps in fall 2012 equates to 2.25 “full fuel-runs” before succumbing to debris. In 2004, green-flag pit-stops ranged from 59 to 64 laps after a restart at Charlotte Motor Speedway. Thus, every 61.5 laps of green-flag racing in that event constituted one “full fuel-run” at that track for that year. That event consisted of a 160-lap green-flag stint which converts to 2.60 “full fuel-runs.”
I complete this exercise for all years, tracks, and green-flag segments. For events in which green-flag pit-stops never occurred, I use tracks of the same distance and the same year to gauge a hypothetical pit-window. While my methodology fails to account for alternative pit strategies and assumes a discrete instant of a “cycle” of pit-stops, I find my adjustments as very reasonable. Additionally, the final results prove to be highly predictable:
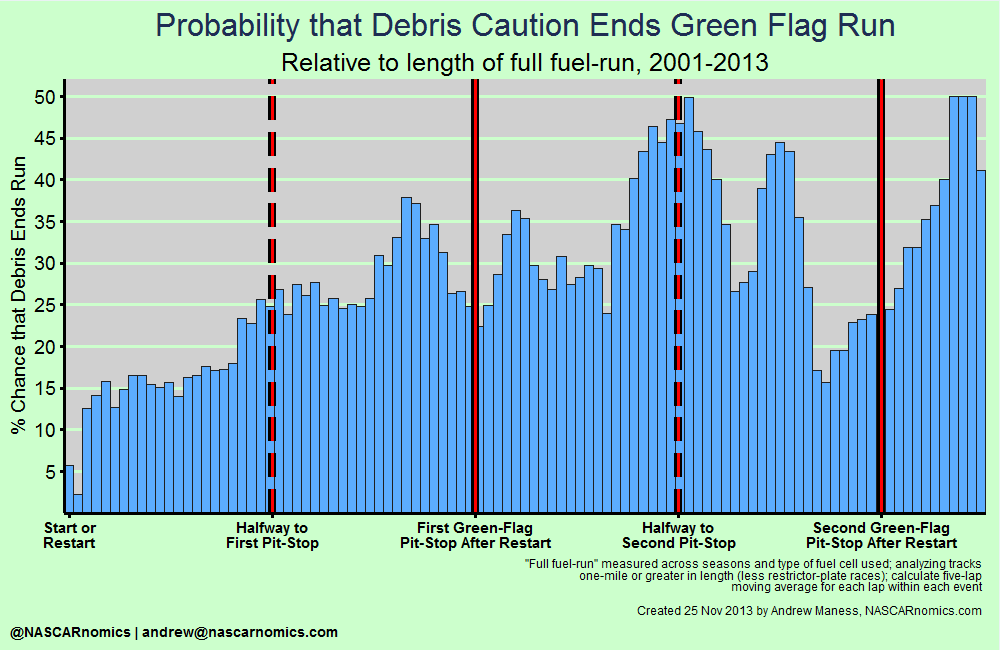
Each blue bar represents the number of laps driven on two-percent of a tank of fuel. (A good comparison would be each bar associating with 1 lap at Charlotte Motor Speedway.) The height of the bar corresponds to the probability that a green-flag run culminates with a debris caution. Simply put — the taller the bar, the greater the chance that a caution appears for debris on the racetrack.
At the start of a green-flag run, the chance of a debris caution is low. By the first red dotted-line — halfway to the first round of green-flag pit-stops — there’s about a 25% chance that a green-flag run would end because of debris. That probability increases to almost 40% immediately before the first cycle of pit-stops. The chance of a debris caution decreases during the cycle of pit-stops and then spikes upward right after pit-stops conclude. About half-way between the first and second pit-stops of a green-flag run, debris disrupts the event half of the time. Similar to the first round of green-flag pit-stops, the second round produces a lower risk of debris’ hampering the pace — right around 25%. Finally, the chance of NASCAR’s throwing the yellow flag for debris increases drastically after the second pit-stop; once again, that probability of a debris caution rises to 50%.
I got bored and ran the same exercise for all debris cautions in the 1990s:
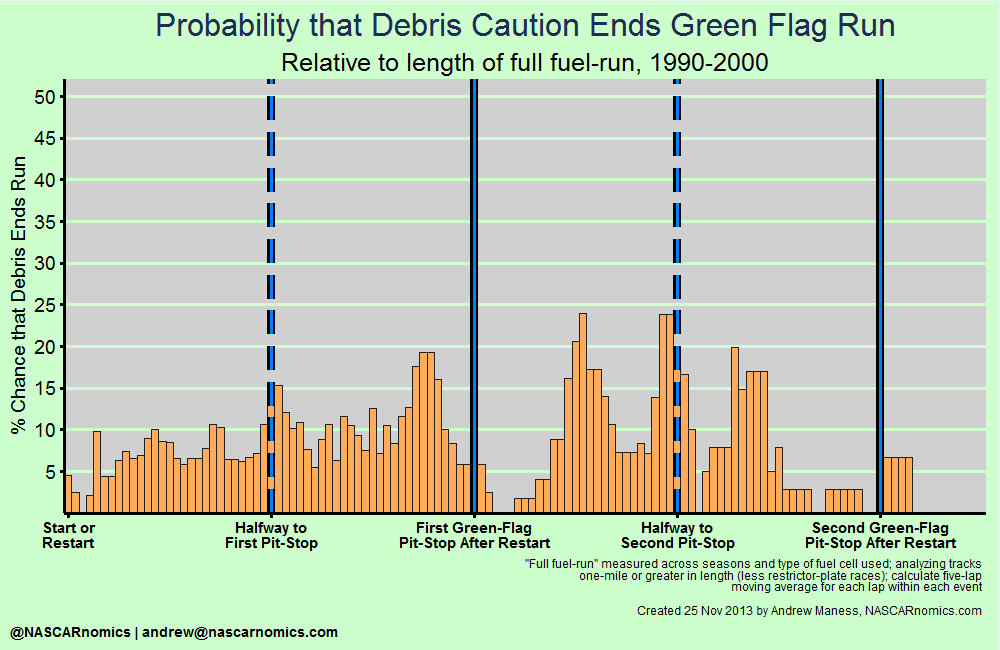
There’s an enormous contrast in the probability for a run-ending debris caution for each “era.” While the races in the 1990s display a relative uptick in debris cautions before and after the first pit-stop, there isn’t enough information to identify other patterns. During that time period, the chance of a debris caution never rises above 25% at any point in a green-flag run.
What I’ve provided above is a helpful visualization of when debris cautions occur on intermediate ovals in recent years. While there are several arguments that center around the meaning of these cautions, this entry objectively analyzes NASCAR’s propensity for caution flags due to debris over time.
So what do you think? Was this entry helpful or enlightening? Do you think there’s a definite pattern to when the cautions are thrown? Or is it just serendipity? And why is this only happening on ovals that are one-mile or larger? I never touched much on the heightened years of debris cautions around 2005. What was different about that time period? Am I asking too many questions?
But really. I sincerely appreciate your reading my research. It means a lot to me that you all read these entries. Please ask me questions. Please challenge my theories and methods. It’s how we all gain more knowledge. If you have any thoughts for me, shoot me a tweet at or send me some electronic mail at . Thanks!