
On Cautions…
[NOTE: Plenty of potential analysis exists on yellow flags and television ratings. In the future, I will present research on mechanisms that might affect NASCAR's household audience size, such as the wave-around, double-file restarts, and the elevated risk of accidents following restarts ("cautions breeding cautions"). I think that this upcoming entry is a good starting point for discussion, though. What ideas or questions would you like for me to investigate?]
I read a lot of interesting opinions on how caution flags, wrecks, and other hazards affect NASCAR’s Cup Series television ratings. I list a few of them to map a range of opinions from people of various backgrounds:
- Journalist Mr. Jerry Bonkowski suggests that additional caution flags hurts viewership in an article posted during the heart of NASCAR’s decline on television.
- Captain of industry Mr. O. Bruton Smith campaigns for mandatory cautions in an effort to boost attendance and television ratings.
- Published academics construct a model to explain television ratings and conclude that the number of cautions per race demonstrates no relationship to a household audience, all other race characteristics held constant. This study, however, only analyzes races from 2007 through 2009.
I want to get to the bottom of this. How do caution flags — due to wrecks and other events — affect television ratings? And is Mr. Smith’s suggestion of mandatory cautions a good idea?
Before I dive into the research portion, I present my main conclusions. This should help guide your thought-process as you scan the rest of this entry:
- Generally, caution flags possess a positive impact on television ratings; specifically, hazard periods due to accidents and spins increase viewership. Non-contact caution flags have no effect.
- Quad-ovals and short tracks benefit the most on television from additional wrecks.
- The severity of a wreck, i.e. the number of cars involved in an accident or spin, demonstrates no statistical relationship with NASCAR’s television ratings. Daytona and Talladega, however, are relatively close to displaying this characteristic.
I begin with a graph that plots the average number of cautions per race. The blue bars indicate the number of cautions per event for each year from 1990 through 2012. The super-imposed red line displays the trend of NASCAR’s median rating from 1997 through 2012.
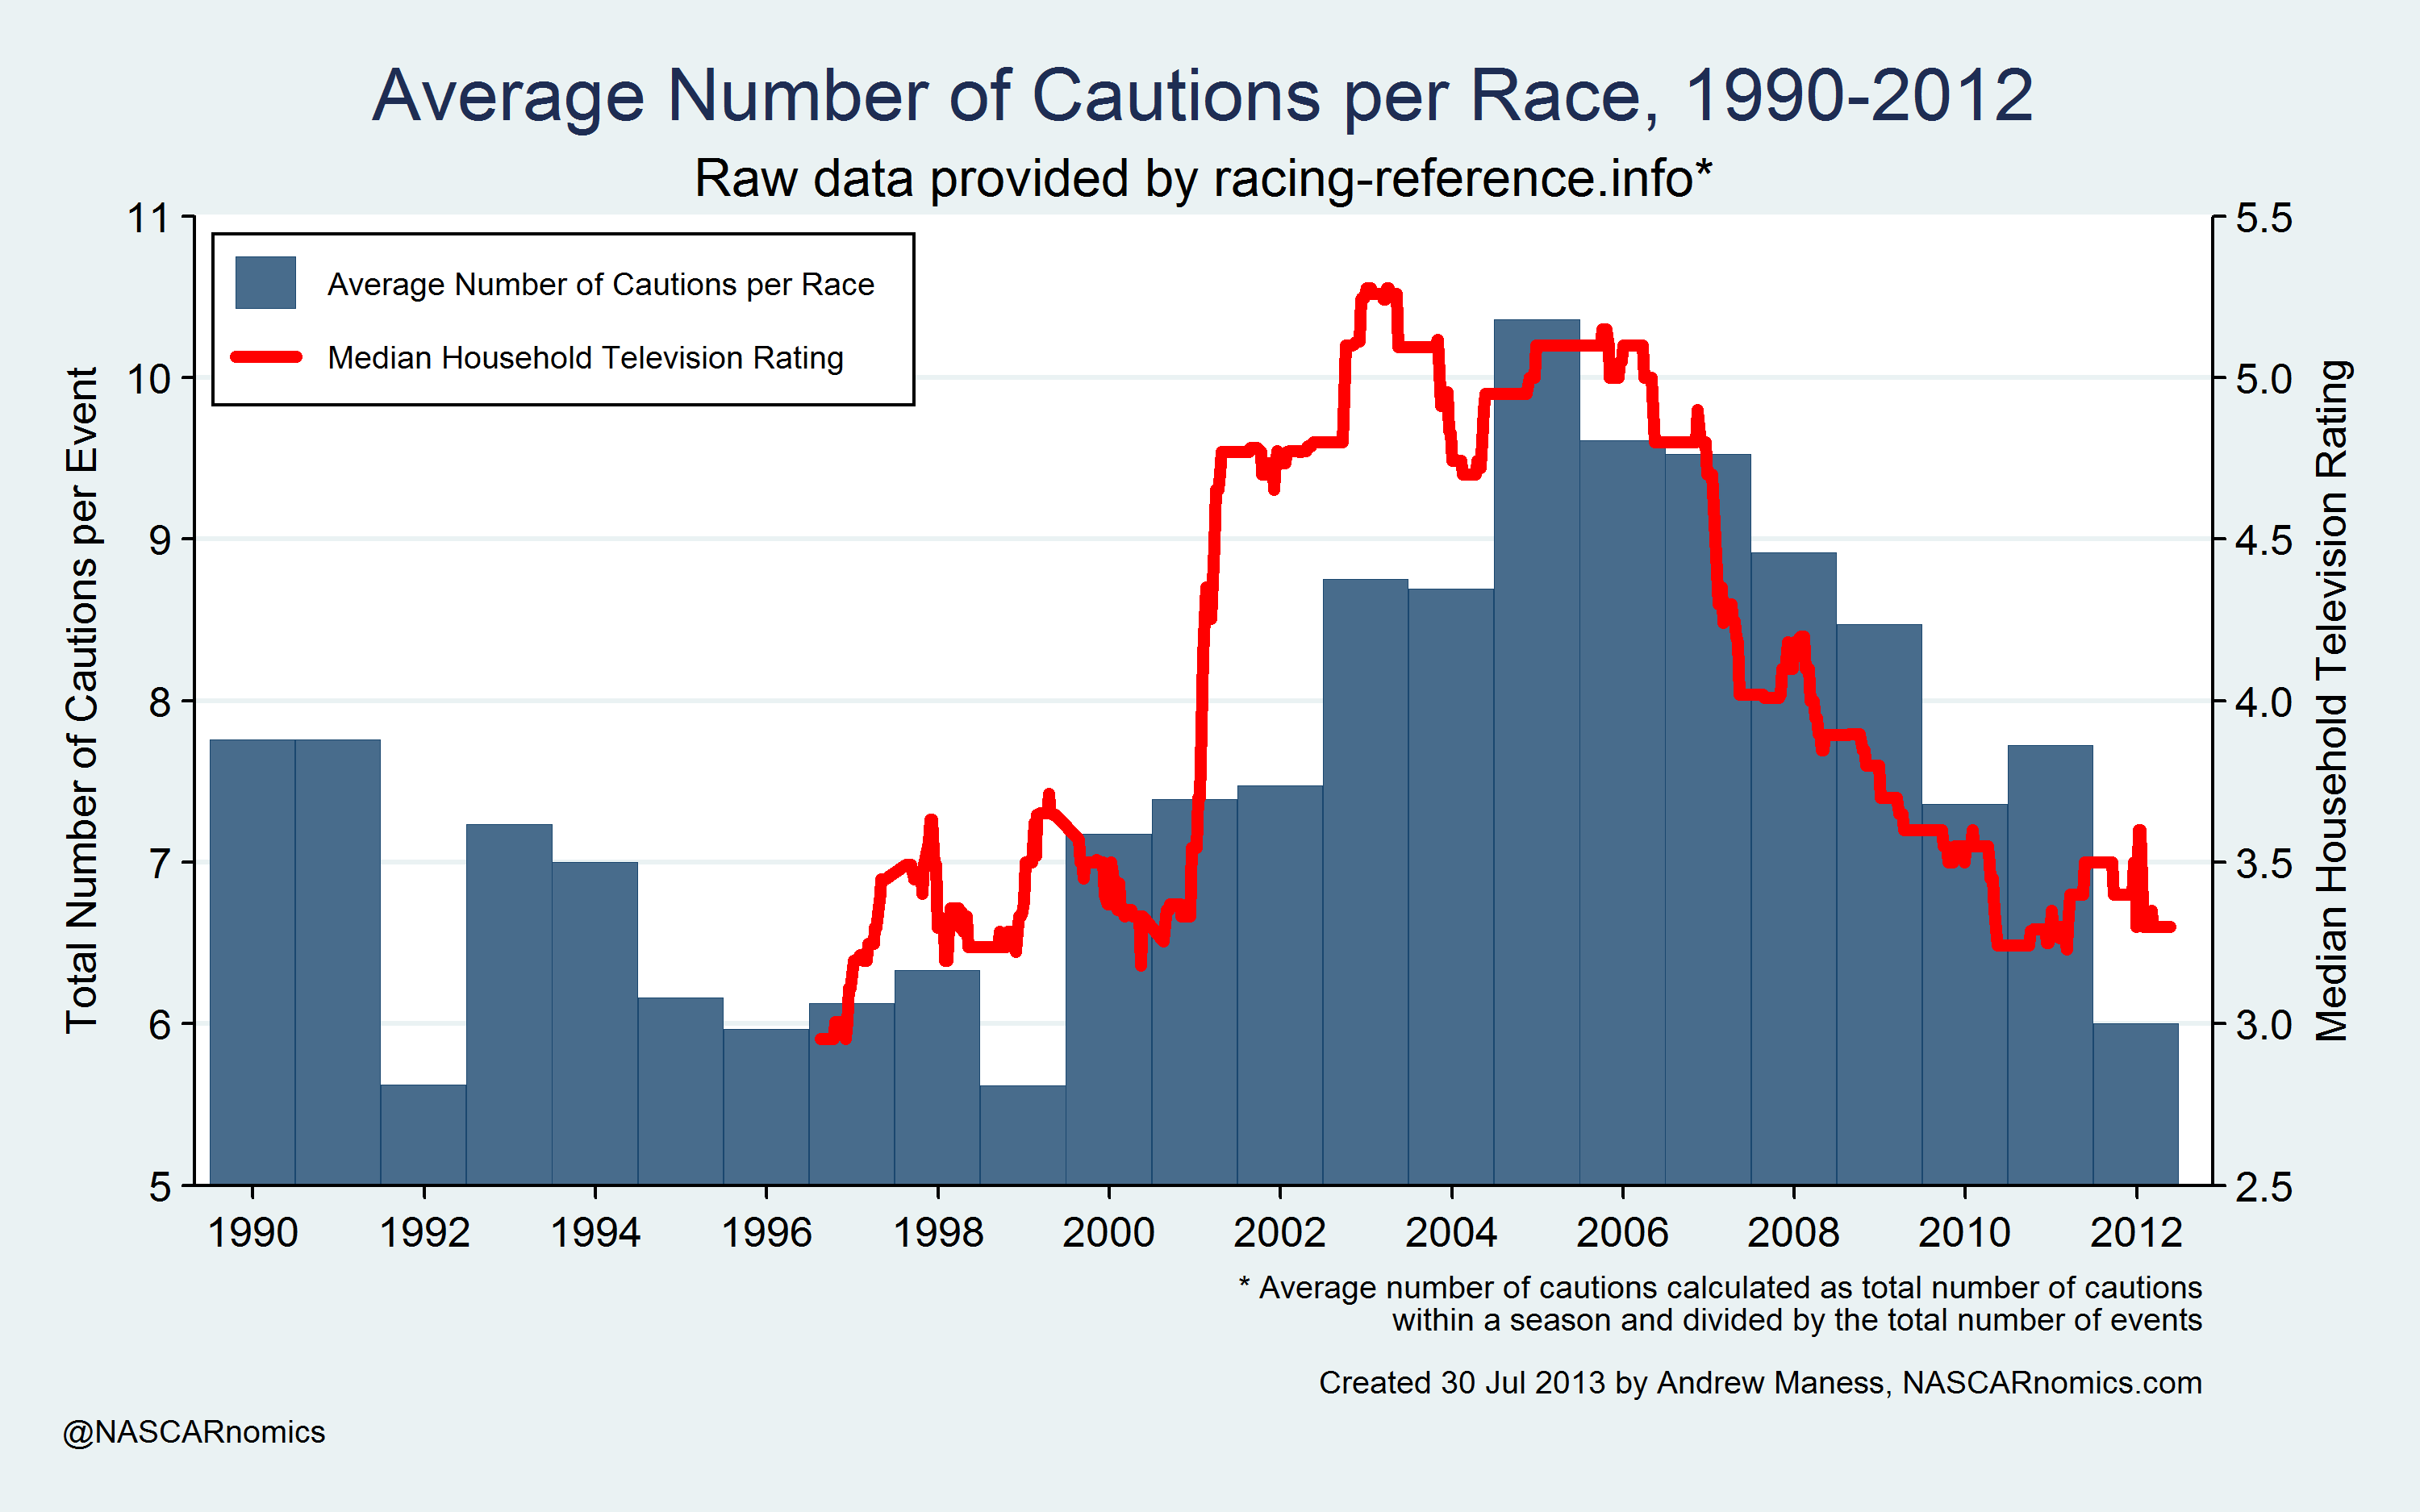
A strong relationship appears between the two variables. As the number of yellow flags increases, the average rating tends to increase. Similarly, the Cup Series’ slide in television ratings from 2006 through 2011 coincides with a reduced incidence of cautions. This is a good starting point for my analysis, but I acknowledge that NASCAR’s ratings grow in the early 2000s due to a centralized television structure that was very over-the-air friendly. There are a host of other characteristics that drive television ratings, too, which is why calculating the number of cautions’ marginal impact on household audience size requires regression modeling. That is, I want to neutralize all of those other race characteristics to “single-out” the impact of cautions on television ratings. After running this experiment, I find the following result:

(You can view the entire results for all race characteristics here.)
The “Total Caution Flags” coefficient is 0.007. This means that each additional caution flag increases the household audience size by roughly 0.7% (Statistically speaking, the true value lies between 0.4% and 1.0%.) That marginal effect supports the hypothesis that more cautions are preferable to the entire household audience watching a Cup race.
But the problem with this analysis is that the yellow flag mechanism represents a host of different inputs. A caution is triggered by different events such as wrecks, debris, mechanical failures, and other phenomena. My estimate of a 0.7% increase in television rating per caution flag fails to take into account different kinds of hazards. Which ones are responsible for fans’ preference for more yellow flags? I inspect different caution events and how they impact television ratings. The following chart splits caution triggers into different event types. I plot the average number of cautions per race by year due to each event in the quadrants below.

The number of wrecks per race follows a similar path as the total number of cautions reported in the previous bar chart. The number of wrecks decreases in the mid- and late-1990s, perhaps due to Hoosier’s exiting the Cup Series and, thus, ending the “tire war.” (I would be grateful to get some motorsports “veterans’” hypotheses on that.) 2012 displays the fewest number of wrecks per race within the sample period. Debris cautions increase five-fold in the mid-2000s from one caution event every two races in the 1990s. Yellow flags due to teams’ mechanical issues and other hazards display no apparent trend over the past twenty-two years.
I estimate the impact of wrecks (the sum of accidents and spins) and other non-contact cautions flags on television ratings. To do so, I run another regression output that holds several variables constant and includes two caution triggers — one for wrecks and the other for non-contact events. The following table displays the results:

This clears up the picture quite a bit. Caution flags due to accidents and spins carry a coefficient of 0.007. Just like before, each wreck that causes a yellow flag historically adds 0.7% to the television rating. Meanwhile, all other yellows have a calculated coefficient of 0.003. The confidence interval (highlighted in yellow) demonstrates the term’s insignificance — one cannot be sure if it positively or negatively impacts viewership. Thus, non-contact cautions have no effect on household ratings. Historically, non-contact cautions do not lead to a wider audience; rather, each additional wreck drives viewership by approximately 0.7%. It follows that Mr. O. Bruton Smith’s idea of introducing additional competition cautions would not augment the television rating. (I suppose Mr. Smith’s counter-argument would be that increasing non-contact cautions would elevate the future risk of accidents and, thus, increase ratings; quite frankly, that’s a bit debauched though not incorrect.) And although the number of wrecks’ relationship with the household audience size is statistically definite, the magnitude is quite small — a race that earns a 4.0 household rating would need three additional wrecks to pull a 4.1.
Wrecks, indeed, affect the household audience positively; but how does that effect change across track configuration? I interact the number of wrecks in each race with the type of track in my model. I hold the same variables constant from previous experiments. The following table displays the marginal impact that each additional accident or spin has on the rating of the race:

The only two tracks types which display a statistically significant relationship with the number of wrecks per event are the quad-ovals — Atlanta, Charlotte, and Texas — and the short tracks — Bristol, Martinsville, North Wilkesboro, and Richmond. These seven tracks’ television ratings rely somewhat on the number of cautions emerging from accidents and spins. At quad-ovals and short tracks, each additional wreck positively affects the household audience size between 0.2% and 1.9%.
Finally, I test one more relationship — the severity of accidents and its relationship with television ratings. For example, races at restrictor plate tracks don’t tally very many wrecks. Those events, however, lend to closed-quarters racing that may cause severe accidents, i.e. “the big one.” I define the “severity of wrecks” as the number of cars involved per wreck within a given race. I test whether this concept is related to television ratings:

There is not a very strong relationship with any track configuration and the severity of a wreck. Daytona and Talladega, however, are relatively close to being statistically impacted by the severity of wrecks, which makes sense. As mentioned, those two restrictor-plate events lend to spectacular, though rare, accidents.
I am certainly interested to see how these factors change over time. The year-to-year element is a concept that is difficult to model; there are fewer than forty races per year — not nearly enough to draw any major conclusions statistically. Do you think that the number of cautions impacts viewership more or less than a decade ago? What about accidents and spins? Do they influence television ratings more nowadays?
I’ll be back in August with more research on cautions. Exactly how much do “cautions breed cautions?” Does that adage carry varying connotations from track to track? Do household audiences care much for that elevated risk of accidents after a restart? Those are some questions that will be answered in the coming weeks.
I appreciate very much your reading my ramblings. Of course, I’m interested in your opinions, too. You can send me a tweet at or send me deeper thoughts via electonic mail at . Thanks again.