
On Passing…
[NOTE: The Cup series wrapped its flat-track double at Indianapolis and Pocono. As usual, passing on tracks not designed for stock-cars becomes the topic du joir. I thought it would be an easy task to find the relationship between passes and NASCAR's popularity on television... I could tally the total number of green-flag passes per race and compare them to television ratings for the Cup Series. It wasn't that easy, but I'm proud of this piece; it shows how industry (Mr. Brad ) and non-industry (me, ) collaborate to create interesting research.]
Since discussion of the relationship between stock-cars’ ability to overtake race quality surfaced after the Brickyard 400, I investigate how the number of green-flag passes in a race affects television ratings. The purpose of this research is to determine how much on-track passing under green has occurred since 2005 and whether the number of green-flag passes influences people’s race-viewing habits. I construct this analysis with publicly-available “loop data” from NASCAR via racing-reference.info. Here are the conclusions that I draw:
- NASCAR’s “total number of green-flag passes” is an inaccurate statistic. To make it purposeful, I adjust the total number of green-flag passes in each event by accounting for various race-length characteristics.
- Furthermore, champion Cup driver Mr. Brad Keselowski suggests more adjustments to my initial calculations. I model green-flag passes to determine other factors that influence the statistic. I find that night racing, green-flag pit-stops, and double-file restarts all distort the number of on-track passes under green conditions.
- After accounting for these issues, I plot the “restart/pit-adjusted total number of green-flag passes.” Beyond restarts and pit-stops, the ability to pass declines in 2009 and 2010. The adjusted number of passes plateaus in 2011, drops severely in 2012, and remains consistent with NASCAR’s “sixth generation” Cup vehicle.
- I graph the “restart/pit-adjusted” statistic against television ratings. I conclude that the number of passes under green-flag conditions has no effect on television ratings, all other factors held equal.
Simply comparing the number of green flag passes from one year to another provides unrealistic results. A rain-shortened race might understate the anticipated number of green-flag passes in the event, for example. In other words; if a race doesn’t run the scheduled distance, the number of green-flag passes will decrease. Similarly, a race that runs into overtime or includes few caution periods might over-estimate the ability to pass under the green flag. I adjust for these varying schedule lengths and green-flag percentages. You may view a concrete example of the mathematics behind these transformations in this link.
I account for these discrepancies and re-measure the total number of green-flag passes — I call this new value the “Length-Adjusted Total Number of Green-Flag Passes.” With these enhancements to the data, any concern regarding green-flag passing and rain-delayed, overtime, or “oddball” events is mitigated. I plot the median number of green-flag passes for each category below:
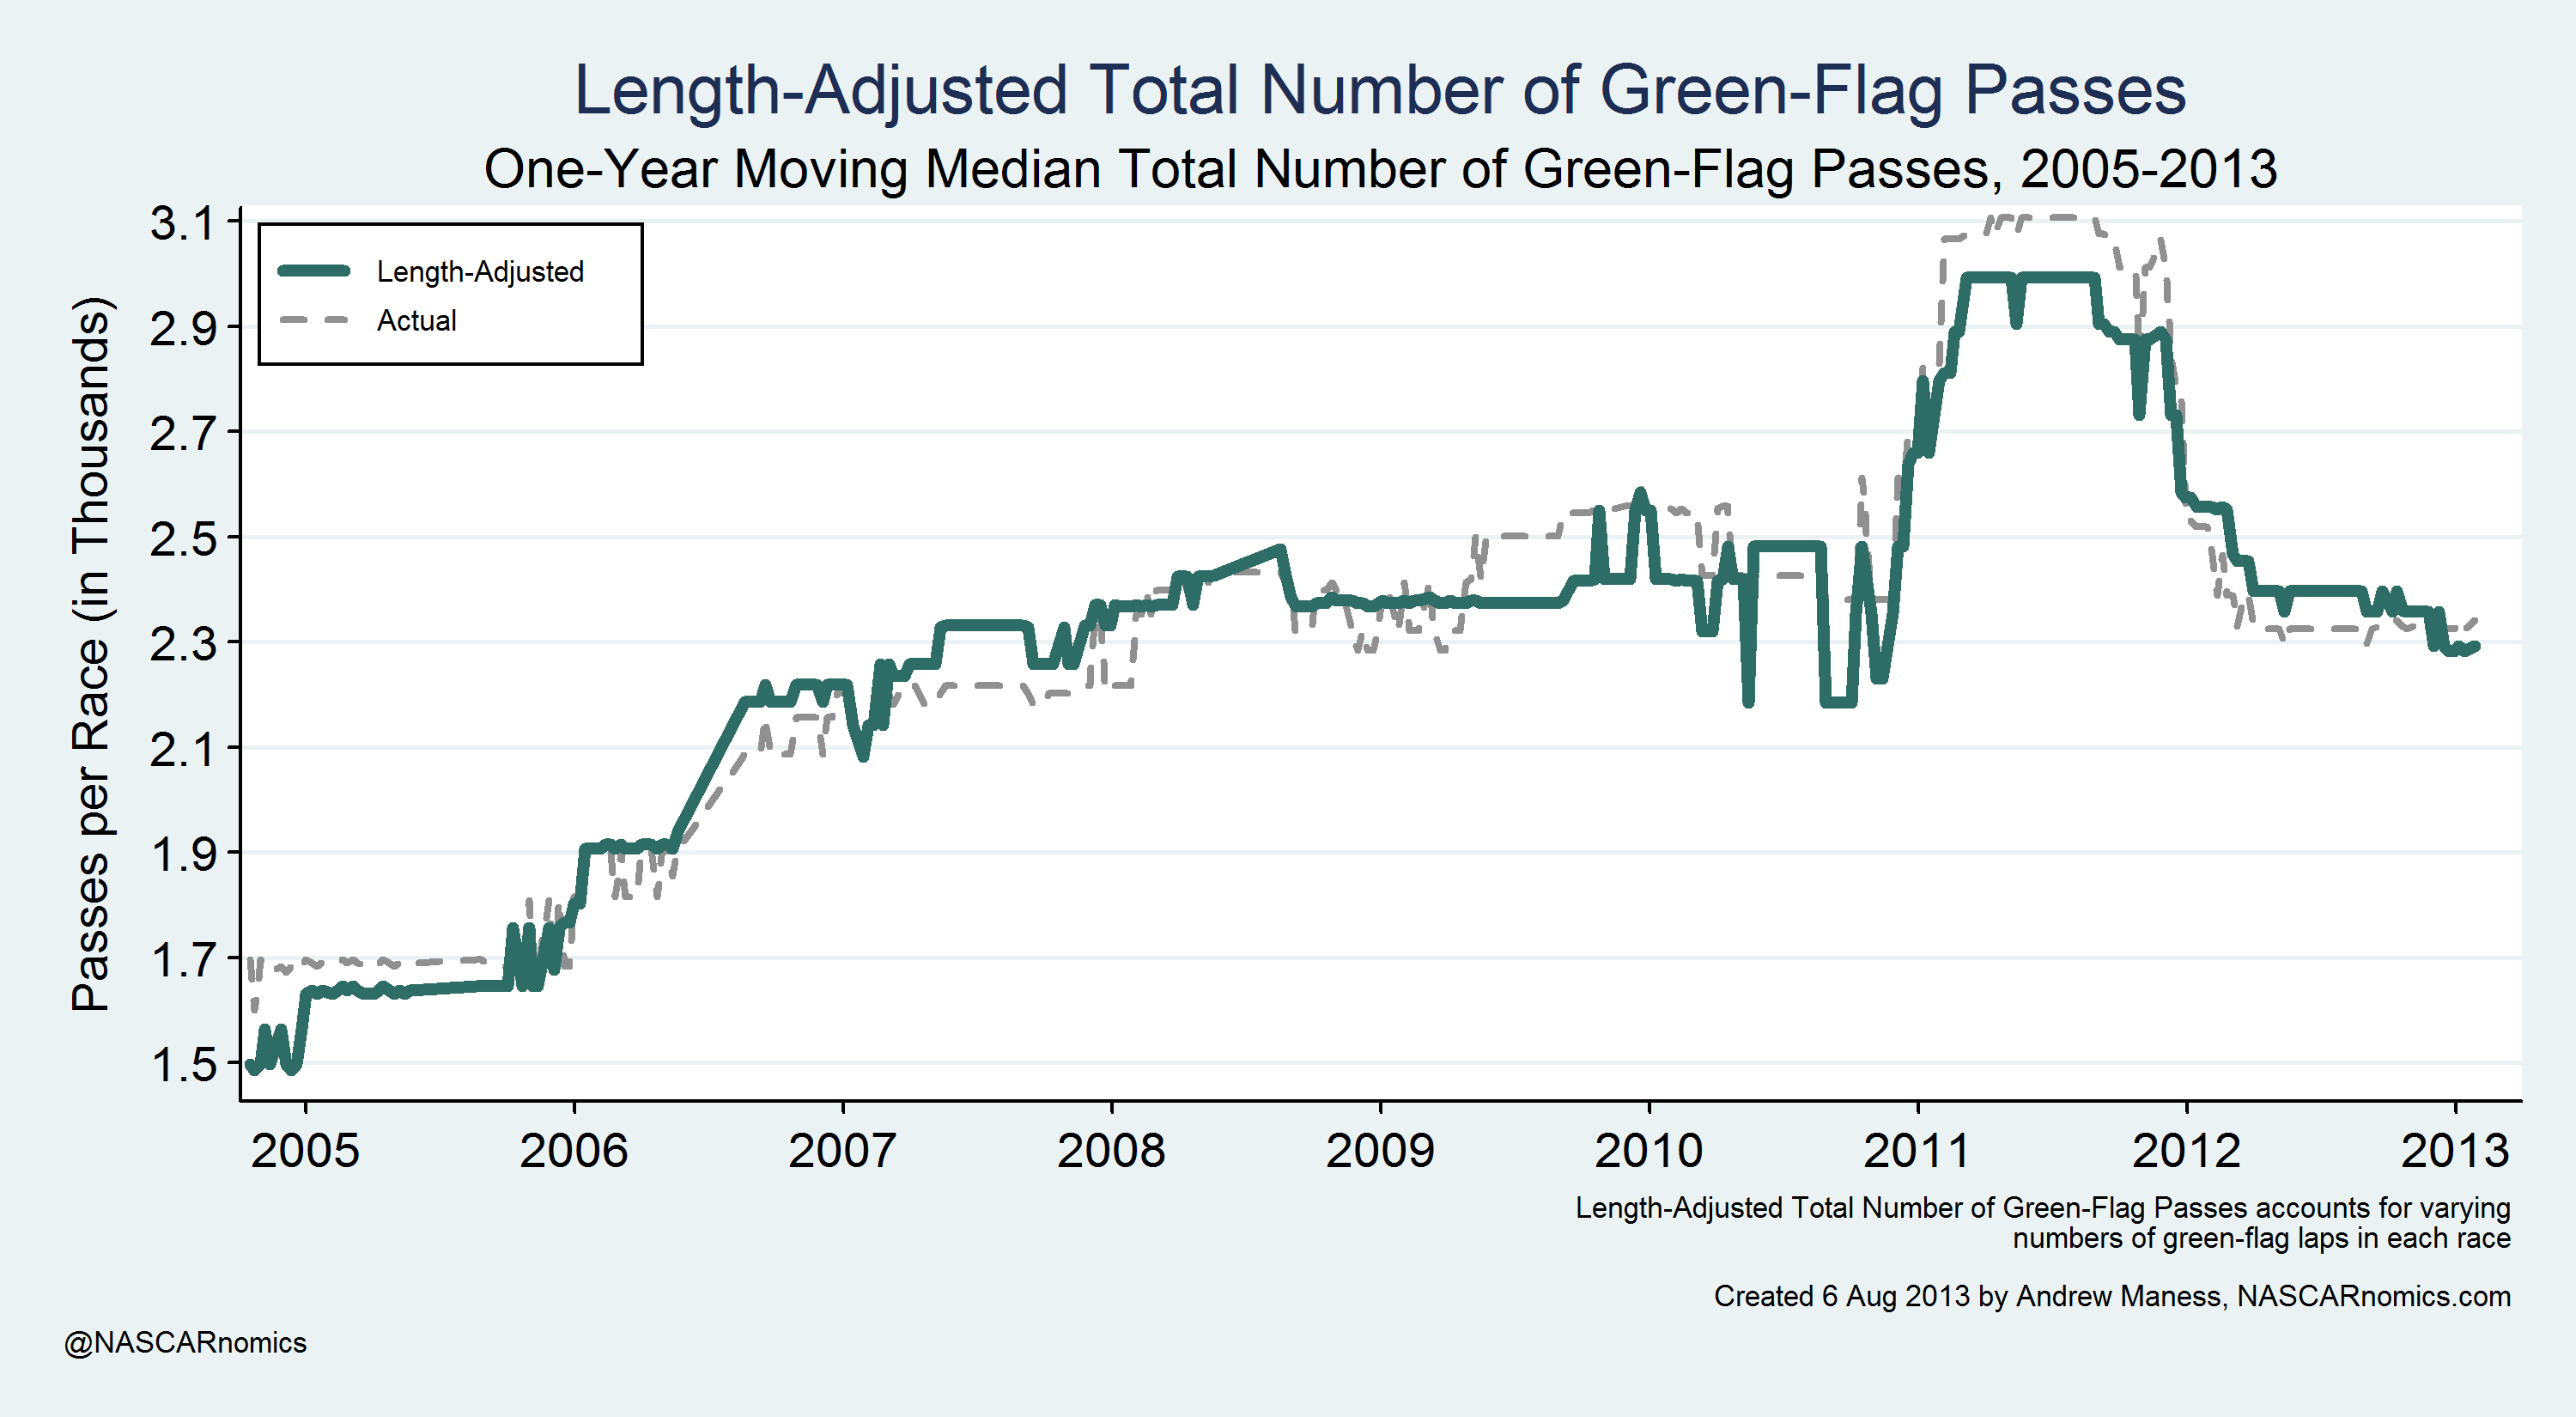
The length-adjusted passing values are lined in a thick emerald marker. My manipulations change the actual number of green-flag passes a little; for example, the number of passes under the green-flag is very inflated in late 2011 and early 2012. At first glance, there appears to be a steady increase in green-flag passing from 2005 through 2011.
After I calculated those length-adjusted green-flag passes per race, I opined that passing has generally increased since the inception of NASCAR’s “loop data.” I was convinced that I created meaningful documentation of traditional green-flag passes. :
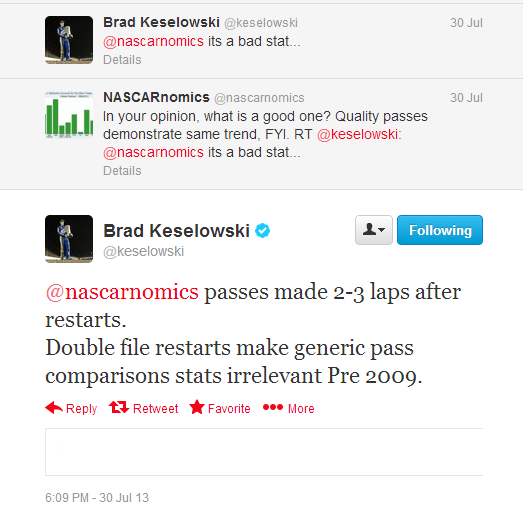
Mr. Keselowski introduces a fantastic point. Double-file restarts help explain why length-adjusted green-flag passing could mis-represent on-track action from 2009 through 2013. In order to compare green-flag passing before and after the creation of the double-file restart, I control those phenomena which improperly influence traditional on-track passing under green-flag conditions. I determine that night races, double-file restarts, rounds of green-flag pit-stops, type of car, and track configuration impact the total number of “length-adjusted” green-flag passes. I execute a regression model which calculates the marginal effects of these instances:
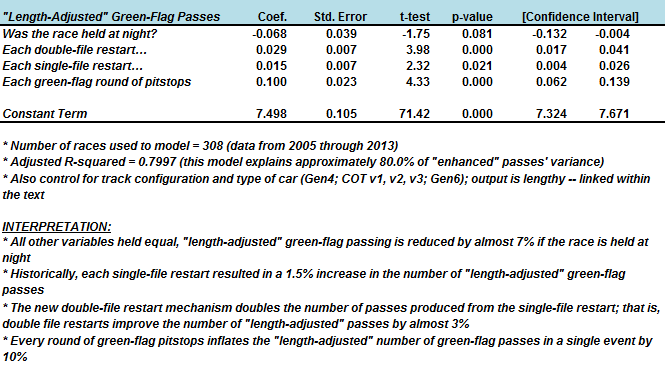
The interpretations of variables are listed directly below the model. As Mr. Keselowski expects, double-file restarts inflate the “length-adjusted” total number of passes since the rule began in 2009. The “double-file” rule adds 90% more “length-adjusted” green-flag passing per restart relative to the old single-file parameter. Additionally, rounds of green-flag pit-stops artificially add to the total number of passes. As a car sits idle for its pit service, its opponents freely run by the entry. Thus, green-flag pit-stops inflate the stock of length-adjusted green-flag passes. Events held at night lend to fewer green-flag passes. This fits-in with the industry-wide belief that tracks generally assume more grip in cooler conditions; thus, cars are less susceptible to passing.
[The model also analyzes car types' marginal effects on green-flag passing at different track configurations. This isn't the focus of my study, but you may find it interesting. You can click this link for a table of the number of enhanced passes by car-type, after neutralizing double-file restarts and green-flag pit-stops.]
I apply Mr. Keselowski’s suggestion and enhance the “length-adjusted” total green-flag passes for double-file restarts and green-flag pit-stops. To do so, I apply the “double-file restart” effect to races that only used single-file restarts. Additionally, I assume a track configuration-wide average number of restarts and green-flag pit-stops to reduce the inflation from an inordinately high number of restarts or green-flag pit-stops. The results from these restart and pit-stop changes are called “Restart/Pit Adjustments.” I continue my adjustment example from above in this link. (These tables are rather big and “math-y,” so I do not list them on here. Please peruse them at your convenience and ask questions, though.)
After neutralizing these race characteristics over the entire sample period, I plot the final “Restart/Pit-Adjusted” total number of green-flag passes per race:
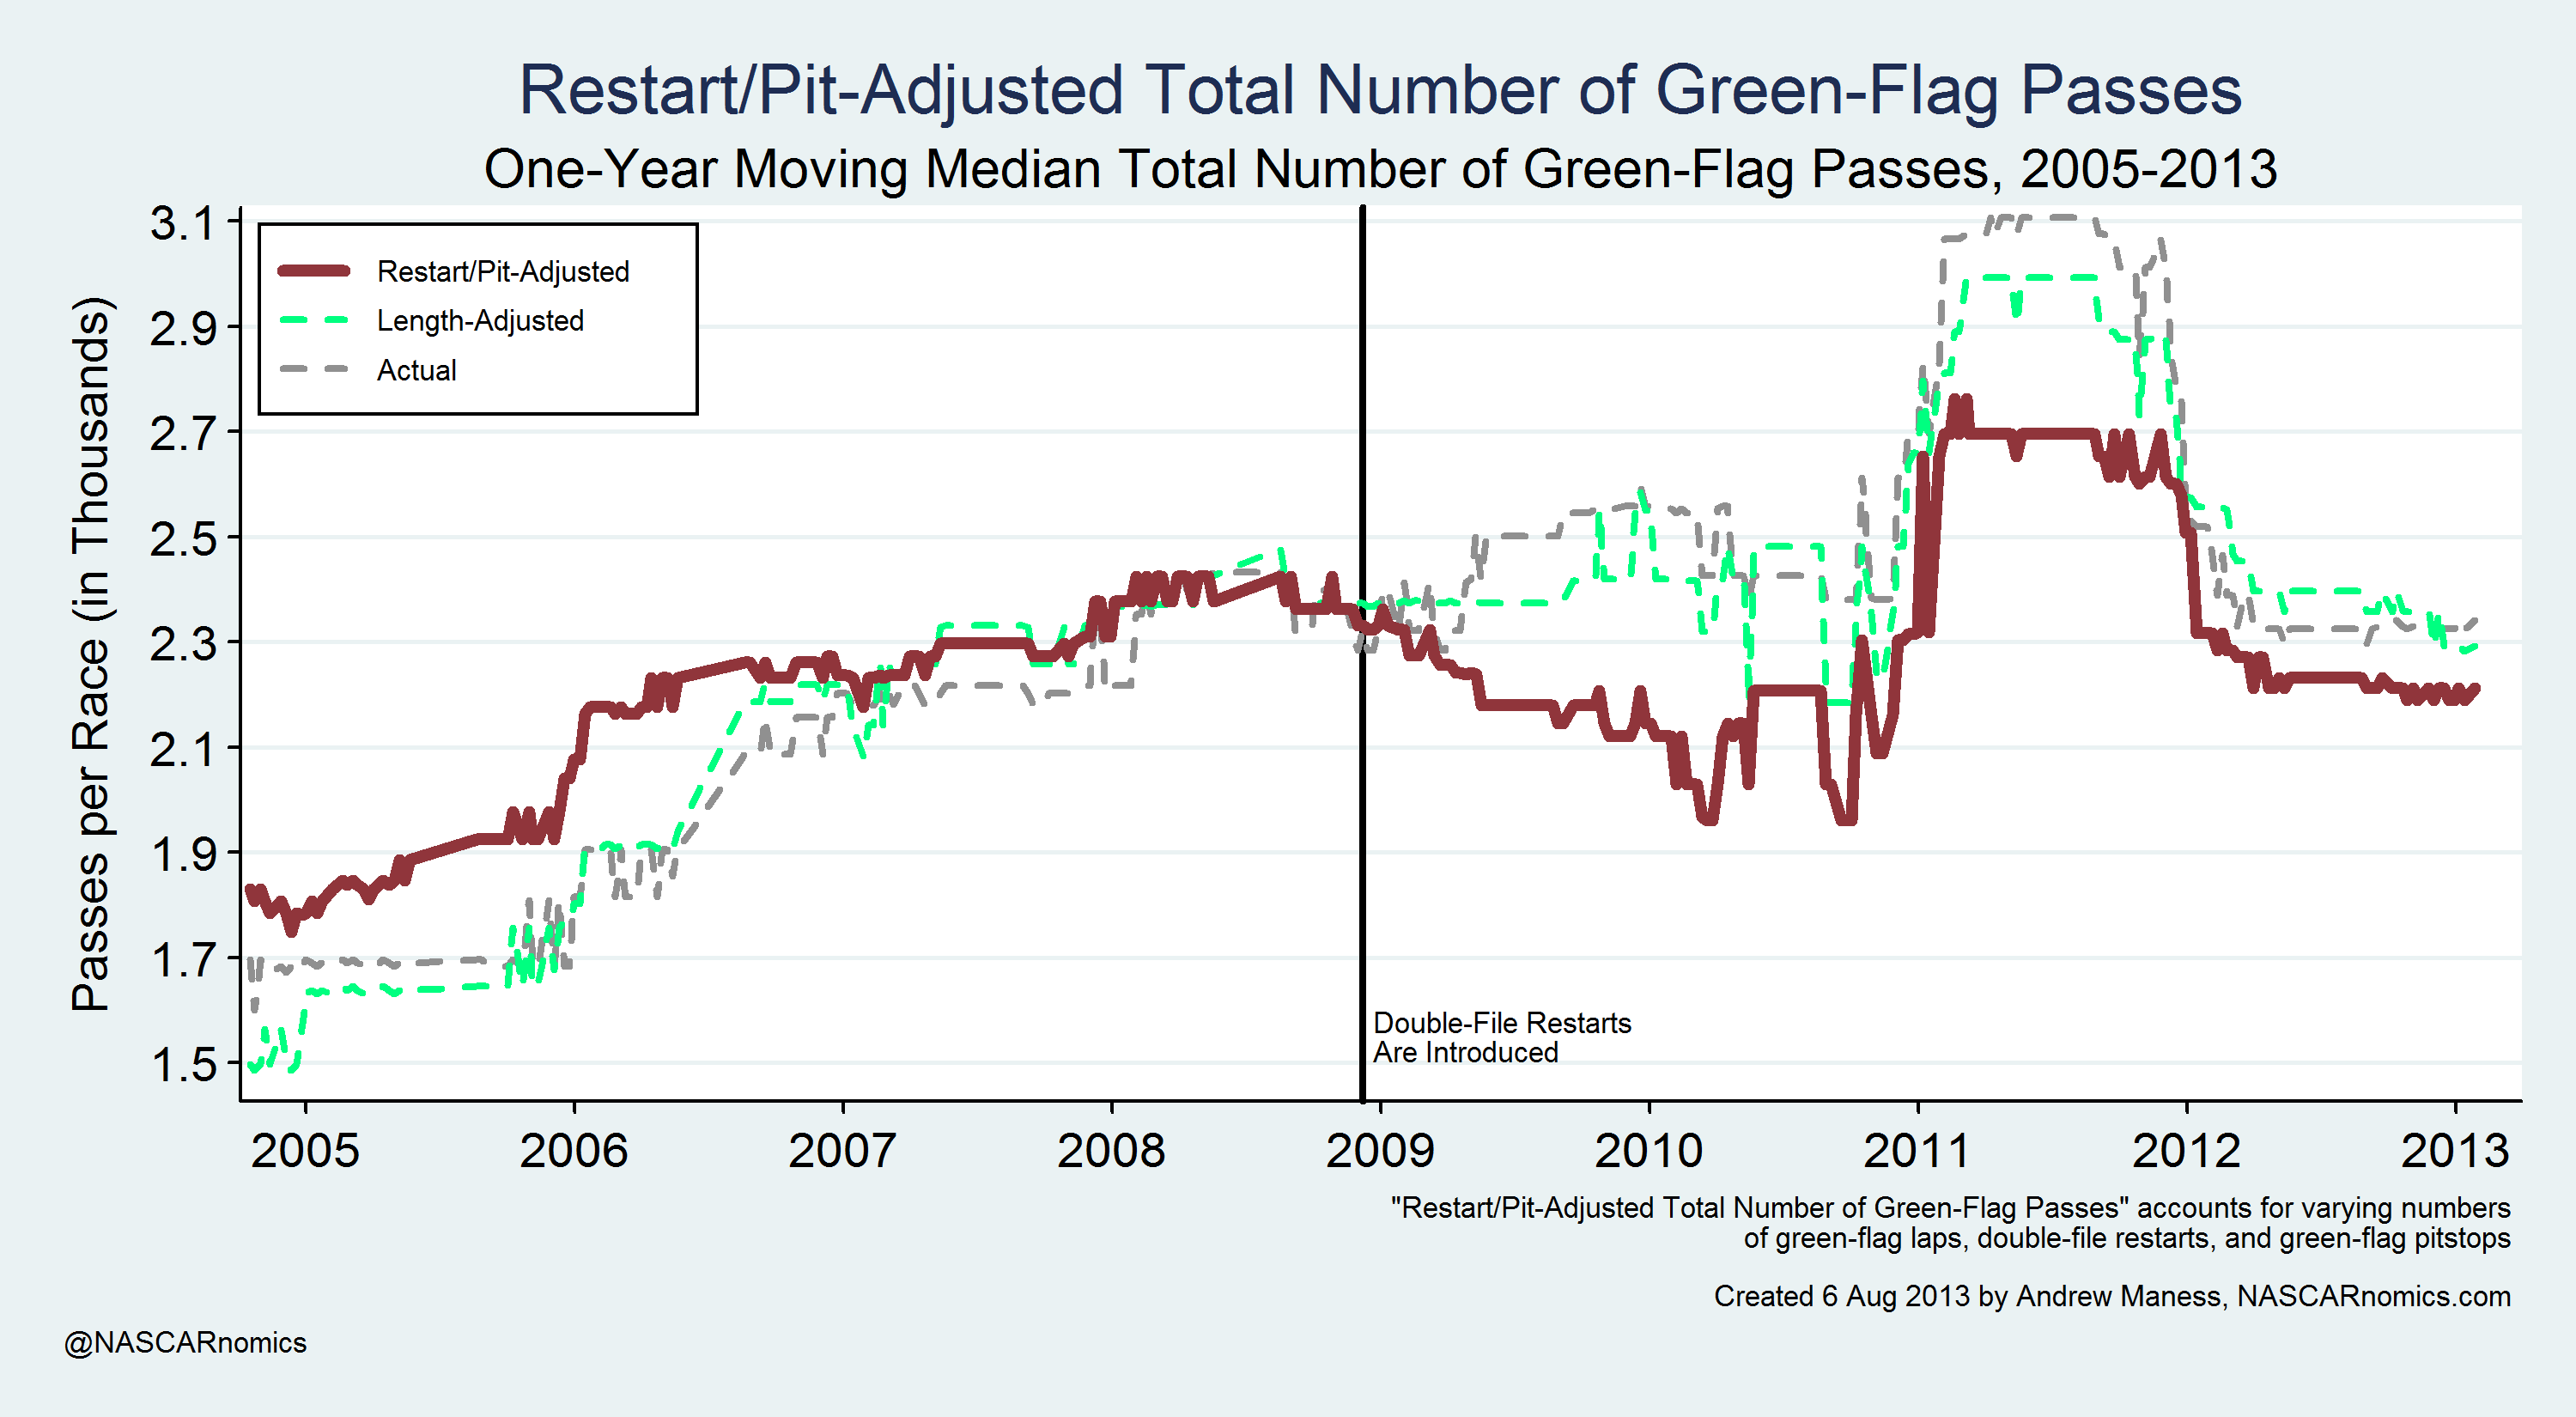
The “restart/pit-adjusted” green-flag passing statistic is marked with a thick maroon line, while the length-adjusted and actual green-flag pass statistics are dotted in the background. As evidenced by the restart/pit-adjusted statistic’s divergence from the other two passing values, the double-file restart implementation masks a major decline in on-track green-flag passing in 2009 and 2010 . (In contrast, the single-file restart era demonstrates more on-track, post-restart passing than the raw data suggest.) The number of on-track passes after restarts improves immensely in 2011, though not by nearly the amount communicated in the simple “total passing” statistic. The restart/pit-adjusted number of green-flag passes drops severely in the Car of Tomorrow’s lame-duck season (2012). It is clear that the ability to pass on-track in NASCAR’s Cup Series is overstated by more green-flag pit-stops and the double-file restart rule. Despite that inflation, however, the final two versions of the Car of Tomorrow lead to an increase in the “restart/pit-adjusted” number of green-flag passes.
But how does this “restart/pit-adjusted” pass statistic relate to television ratings? Do more people watch an event if a race has more traditional, on-track passing under the green flag? This graph offers a visual comparison of the two values:
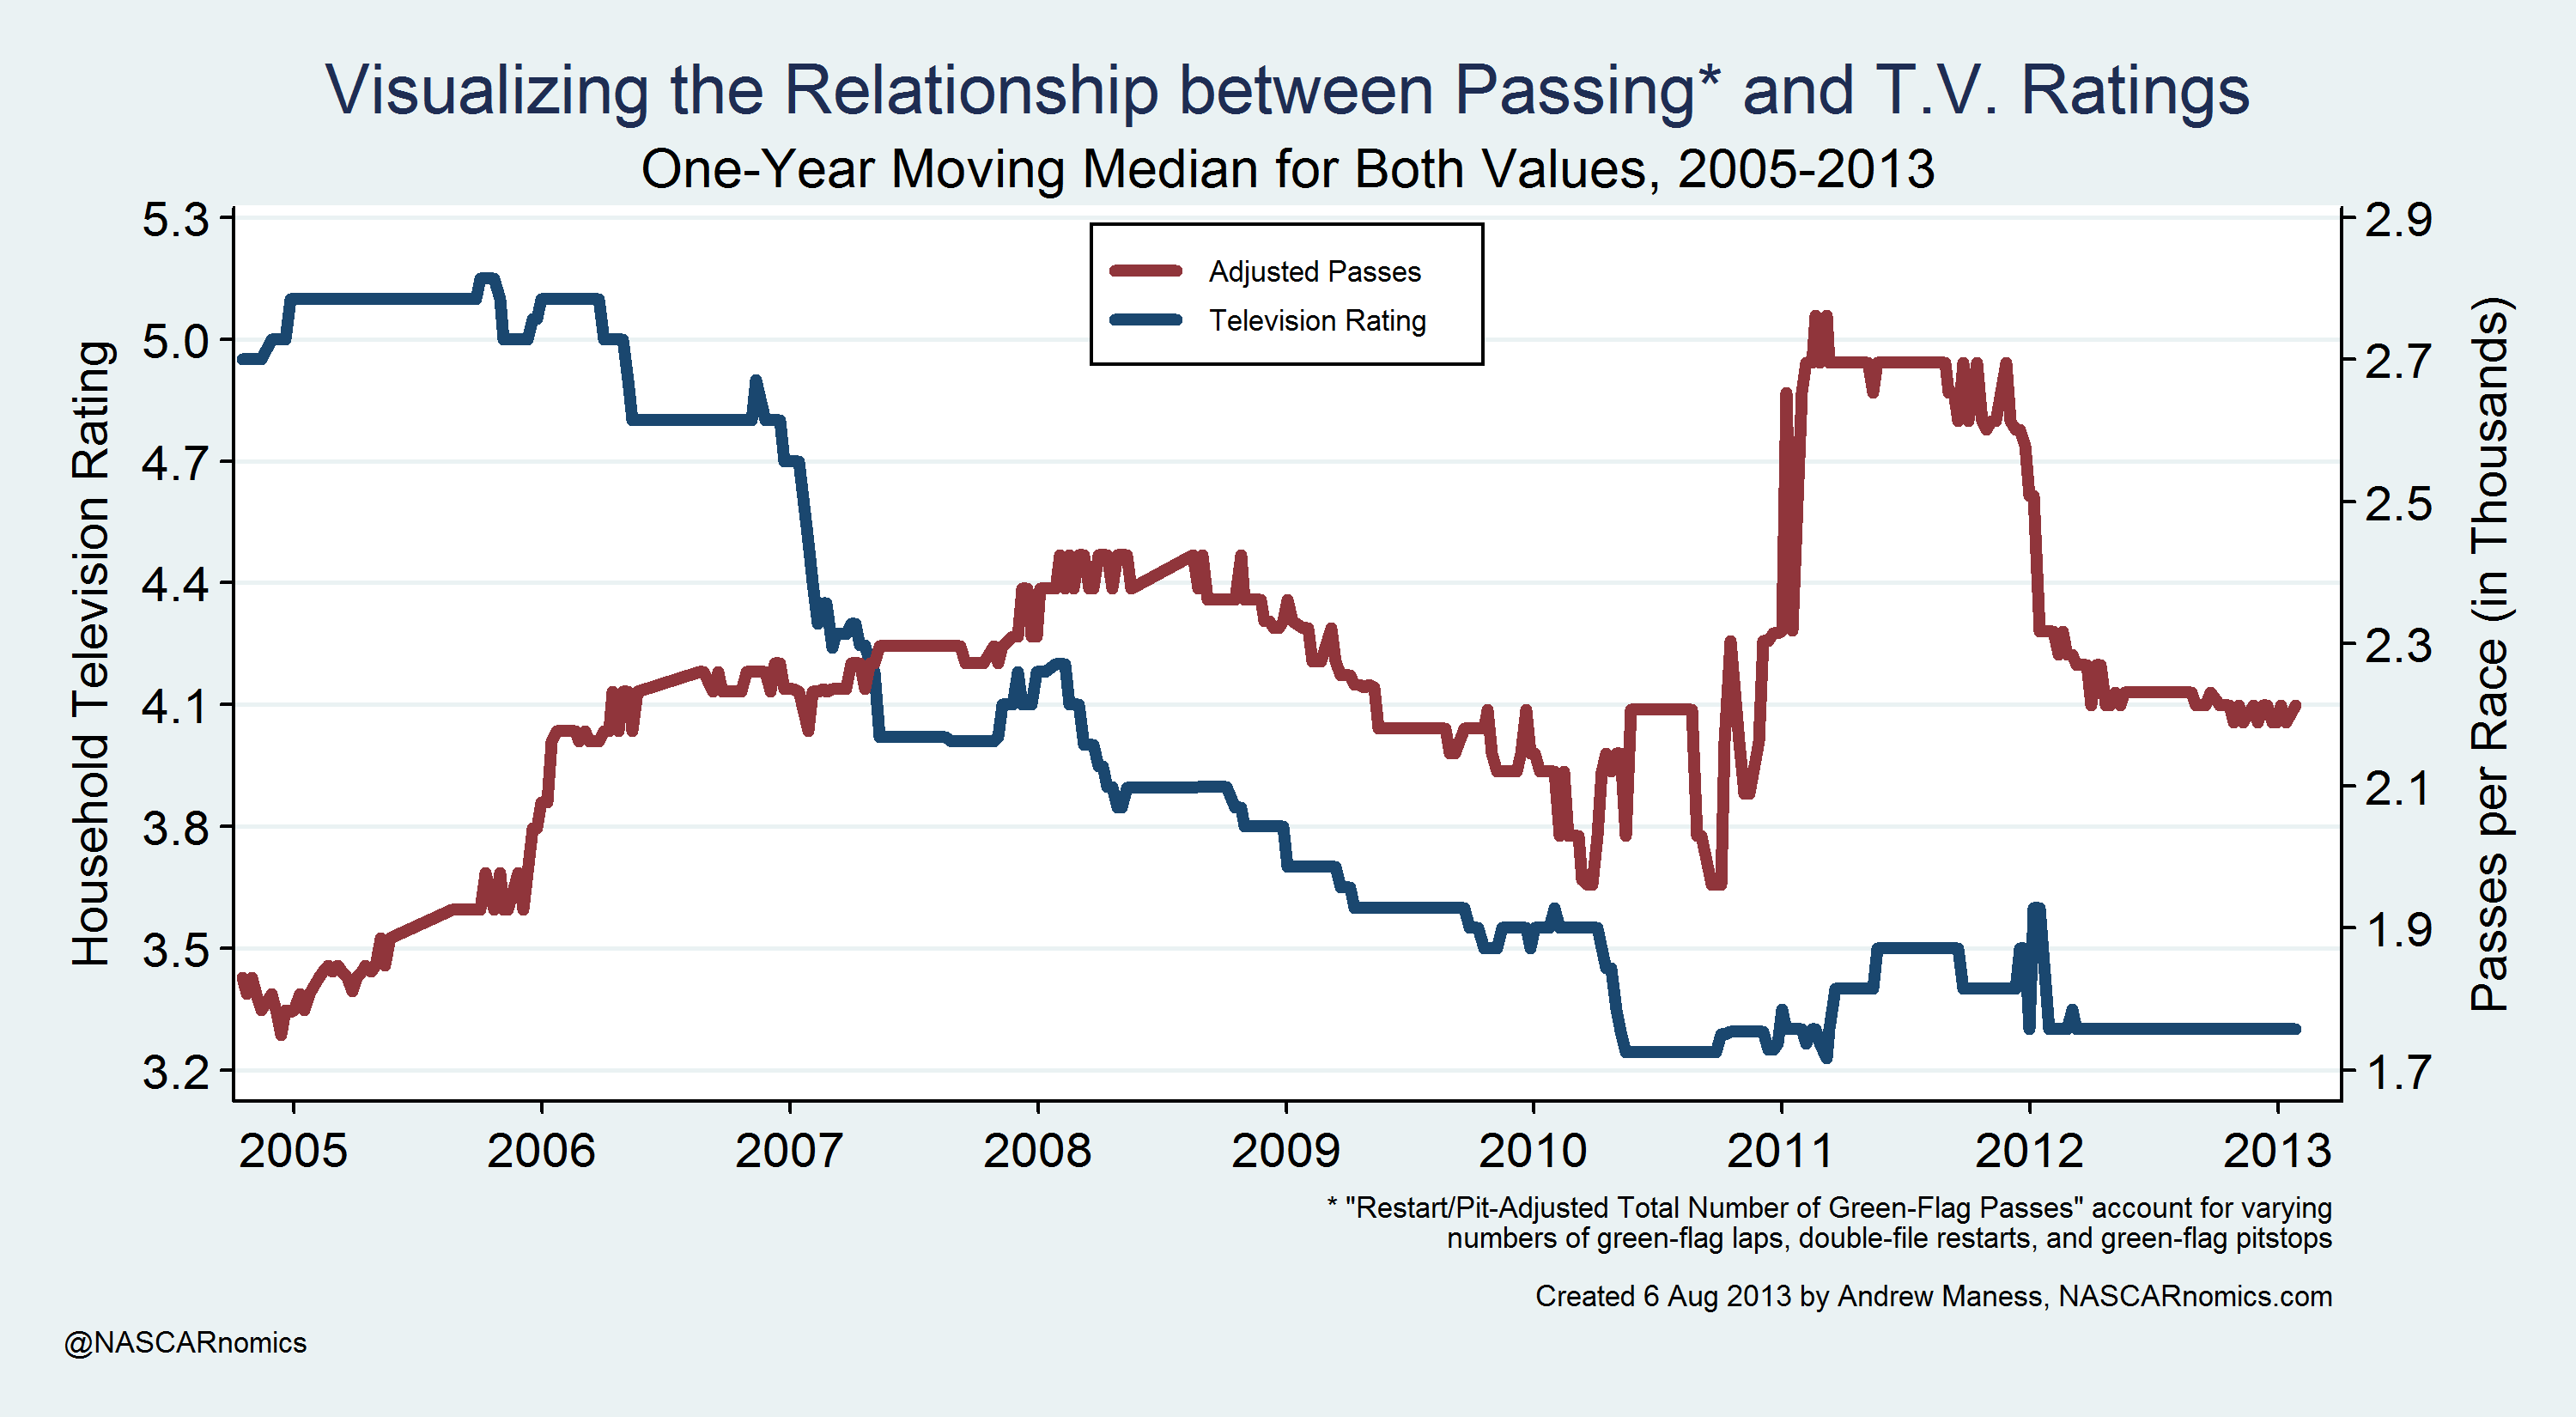
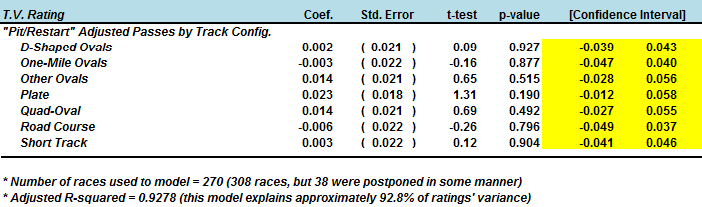
On the surface, there might be a relationship between the adjusted number of green-flag passes and household television ratings. As the pass-number drops from 2008 through 2010, household television ratings decline as well. Other factors influence NASCAR’s ratings, however. The augmentation of races on cable television, an increased number of night races, and the popularity-explosion of the National Football League all contribute to that decline. I control for those external factors and determine whether the “restart/pit-adjusted” number of green-flag passes influences television ratings for the Cup Series:
(You can view the entire model here.)
After accounting for other variables that impact NASCAR’s television ratings, one cannot conclude whether the “adjusted” number of green-flag passes has a positive or negative effect on household ratings (the real answer falls between the highlighted values). For every track configuration, the adjusted number of green-flag passes demonstrates an ambiguous impact on the Cup Series’ television ratings. The number of green-flag passes — after accounting for race-length, double-file restarts, and green-flag pit-stops — exhibits no statistical relationship with television ratings for NASCAR’s Cup Series. Restrictor-plate tracks, however, exhibit a small, inconclusive trend that more green-flag passing relates to higher ratings.
So what do you think? Are there more factors that cloud the understanding of traditional green-flag passing (i.e., one car’s overtaking another on-track under green conditions)? Does the number of passes in a race influence your opinion of that race’s quality? Does that opinion change with different track configurations? What type of car (Gen4; COT v1, v2, or v3; Gen6) was the most competitive in this time sample? If I measured my “adjusted” passing figure against track attendance (that’s a tricky proposition, by the way), would attendance be more susceptible to the number of green-flag passes?
One statistic I’d like to calculate is the percent of total passes shown on television. Is coverage across NASCAR’s television partners reflective of the true number of green-flag passes throughout a single event? I theorize that the number of passes shown on television might hold a stronger relationship with television ratings.
I appreciate your reading this entry. It was a fun one to craft. Of course, I’m interested in your opinions, too. You can send me a tweet at or send me deeper thoughts via electonic mail at . Thanks again.