
On Cautions’ Breeding Cautions…
[NOTE: It's race-week at Bristol Motor Speedway. Last year was my first experience at Thunder Valley and I loved every lap of it. I'll be there again for the main event on Saturday night. This entry provides a nice preview of what's to come -- I write about "cautions' breeding cautions" on short tracks. I'll be watching for this special occurrence and taking-in all of the grassroots action that BMS provides. Hope to visit with some of you at the tweet-up (I am assuming that there is a tweet-up).]
As is the case with many short tracks, accidents occur and tempers flare at Bristol Motor Speedway. Sticking forty-plus vehicles on a half-mile bullring lends to exciting racing for fans and close-quartered driving for participants. Naturally, this type of racing got me thinking about the traditional saying that “cautions breed cautions.” More specifically, this phrase suggests that a current yellow flag heightens the risk of accidents immediately after resuming green-flag competition. The goal of this entry is to identify the duration of that extra risk of wrecks, to determine how double-file restarts influence this phenomenon, and to examine when the field is most vulnerable to “cautions breeding cautions.”
(I also suggest that you take a gander at my previous research on caution flags here.)
Here’s a quick summary of results forthcoming:
- On short-tracks, the first 35 laps after a restart produce an elevated risk of accidents. This is known as a caution “breeding” another caution.
- In general, double-file restarts have not changed the magnitude of post-restart crashes. That is, the four-year-old restart rule has not significantly altered the time-period of an increased probability of wrecks.
- Specifically, however, double-file restarts do generate relatively more cautions in the fourth quarter of short track races. The number of wrecks within the first dozen laps after a restart increases by over 40% with the institution of the current restart mechanism.
The following chart displays the probability of an accident occurring on a given lap after a restart (denoted as “lap 0″) on short-tracks from 1990 through 2013. On short-tracks, 1,770 starts and restarts have occurred over the past 23 years. 1,395 of those subsequent green-flag runs end in a yellow-flag due to contact, while 21% of these segments end from a checkered-flag or a caution due to debris or other non-contact issues. I tally when each of those nearly-1,400 wrecks took place relative to the previous restart. From this information, I can research the pattern of when accidents happen over the course of a green-flag run. Each gray bar signifies the percent chance of a wreck occurring on that single lap. The dotted purple line marks the average probability of a wreck on a single lap over an entire green-flag run:
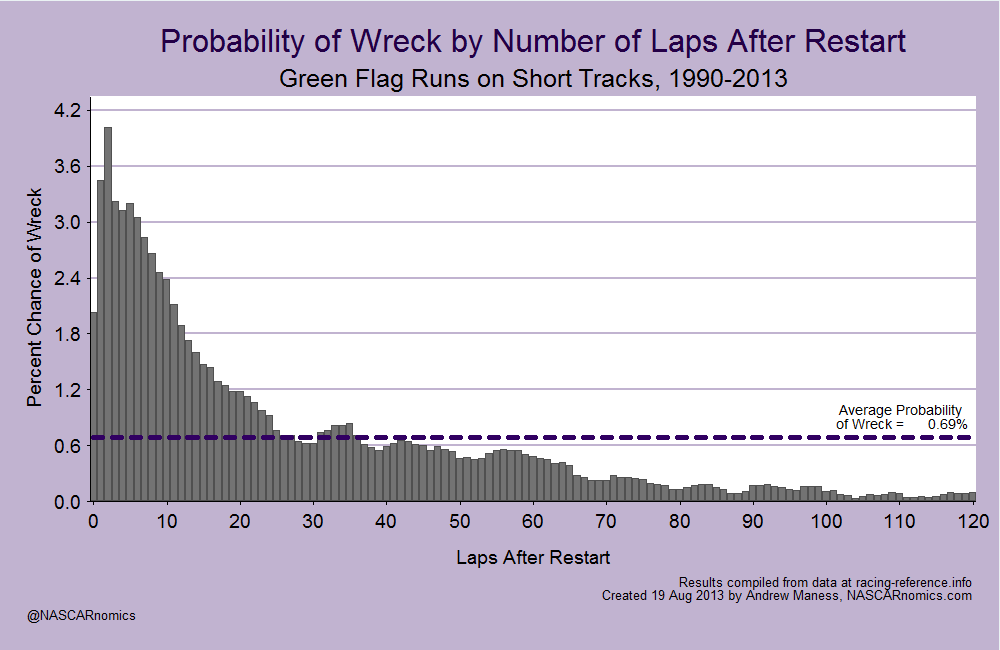
This graph fits with the overall theory that there is a greater chance of an accident in the near-term of a green-flag segment. As a run progresses, however; the field spreads out, drivers can “race the track” instead of their opponents, and the chance of a wreck dissipates. Specifically, the second lap after a restart carries a 4.0% chance of an accident — the most elevated single-lap probability of a wreck occurring during a green-flag run. Furthermore, there is a 30% chance of an accident in the first 10 laps after a restart. A crash unfolds more than half the time within 24 laps upon returning from a yellow flag. It isn’t until 35 or so laps into a green-flag segment that the elevated risk of a crash diminishes below the typical probability of a wreck.
That graph is all good and well, but why stop there? Times change. NASCAR’s top series doesn’t line-up for restarts in the same manner as it did for much of its history. In 2009, NASCAR shook-up the green-flag procedure by lining-up teams according to their position. Instead of reserving the inside line for cars laps down, the current rules move all lead-lap machines to the front of the field. As a result, one expects more accidents immediately after a restart — drivers are surrounded by position battles in-front, behind, and to the side of them.
To account for this rule-change, I compare both types of line-ups on short-tracks in the following chart. I plot the single-file restart era (1990-2009) in gray bars and impose a purple line for double-file restarts (2009-2013):

Hmm. This initial comparison disagrees with my “racing intuition.” I expect double-file restarts to lead to more passing and aggressiveness; and thus, a higher probability of wrecks early in a green-flag run (relative to the single-file method). This chart, however, suggests that the double-file mechanism instituted in 2009 hasn’t led to any of that. Rather, it conveys that the double-file restart has not changed the overall landscape of post-restart incidents.
The data do not agree with the anecdote that bunching competitors under a double-file condition leads to more accidents. Now, some economists and statisticians would cling to their data and declare that double-file restarts do not intensify the “cautions breeding cautions” phenomenon. But that’s not what NASCARnomics.com is about — the objective of this website is to marry industry’s thoughts with quantitative research. So I dig a bit deeper to reconcile this difference.
I split the race into quarters (as one would for football game) and investigate the change between single-file and double-file restarts:

So things clear-up quite a bit here. While the first three quarters’ lap-by-lap probabilities remain similar before and after NASCAR’s double-file installment, the final segment of a short-track race exhibits the trend for which I am seeking. In the fourth quarter of a race, the double-file restart demonstrates a strong relationship with more wrecks at the front-end of a green-flag run. In fact, the second lap (just one single lap, mind you) after a restart produces a contact incident almost 10% of the time.
When the stakes are highest (toward the end of a race when points are tallied), drivers perhaps become more aggressive in gaining an extra position or two. (The middle portion of a green-flag segment in the third-quarter of a short-track event bolsters that theory. Notice the heightened level of “wreck probability” in the double-file restart era from laps 50 through 60 in the third quarter. As a race approaches its final phase, opponents may get impatient despite being relatively spread-out. And when that caution occurs, yellow-flags begin to plague the field for the rest of the event.)
In the fourth quarter of a race, an incident due to contact occurs more than half of the time within the first dozen laps after a restart, whereas the same length only produced wrecks 35% of the time in the single-restart restart era. As a simple comparison, double-file restarts lead to 43% more accidents in the final quarter of a race than the old single-file restart rule.
So that’s it. I wanted to make this entry pretty fun and relevant to the upcoming race at Bristol. I like to investigate moments like this (“cautions breeding cautions”) and then visualize and apply these theories to actual events. Keep an eye on how aggressiveness and driving styles change through the race and throughout green-flag runs on Saturday night.
Once again, I appreciate your reading this website. The posts are sometimes long, but I hope that you’re getting some benefit out of this whole project. I’m having a blast writing about and visualizing all of the neat publicly-available data related to NASCAR.