
2013 Ratings Update: Indianapolis through Bristol
[NOTE: I've recently neglected my weekly summary of the previous race's rating. Time has been a bit scarce, so I chose to emphasize the research aspect of the website. I've stumbled upon some free moments this week -- let's recap the first handful of races that ESPN has hosted in 2013.]
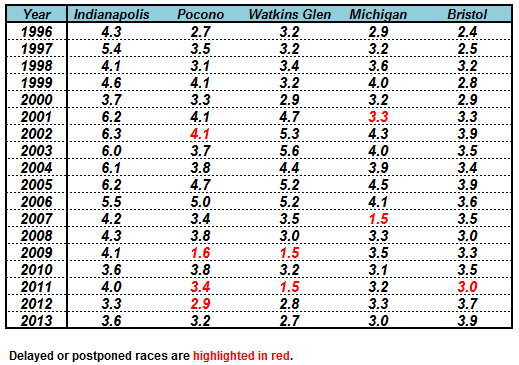
“NASCAR on ESPN” has been in full swing for a few weeks now. The ESPN/ABC crew kicked-off their penultimate annual campaign at the Brickyard. This portion of the schedule provides a good sense for the “pulse” of the Cup Series; the late-summer stretch has remained relatively unchanged since the mid-1990s. I present the actual television ratings for the previous five races from 1996 through today:
These numbers are great and all, but how in the world can one interpret this mess of data? After I adjust for which station aired the race, I compare the five venues using an index method:
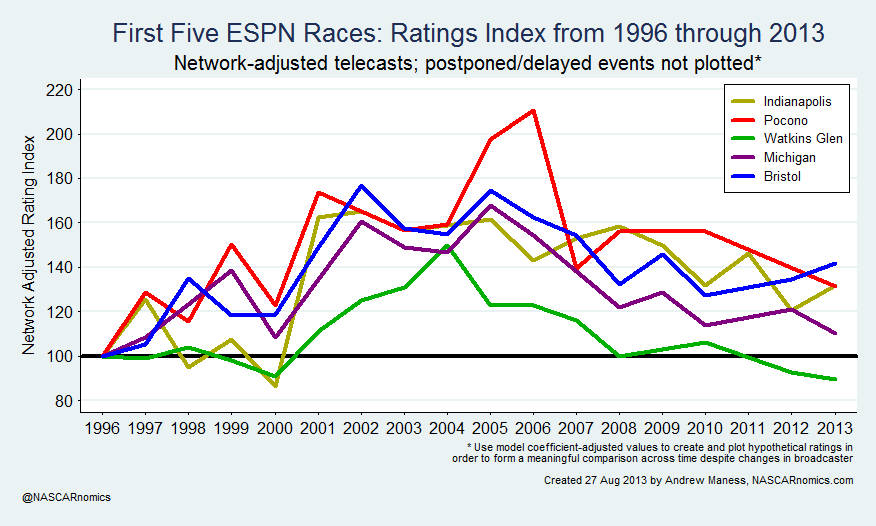 So what is this index method all about? It’s an economic tool used to simplify and compare various trends. In this instance, the base value — 100 — is assigned to the television rating that each track earned in 1996. Anything above 100 represents an increase in the household audience; a number below 100 means that the race is drawing fewer viewers than in 1996. Specifically, every unit in the index represents a one-percent increase relative to 1996. For example, Pocono’s 2006 index rating was 211 — 111% more than the baseline value in 1996. NASCAR’s late-summer series seems to have stabilized its viewership over the past half-dozen years.
How have the ratings fit-in with the rest of 2013? The following chart plots the last five races next to FOX and TNT’s balance of the Cup schedule:
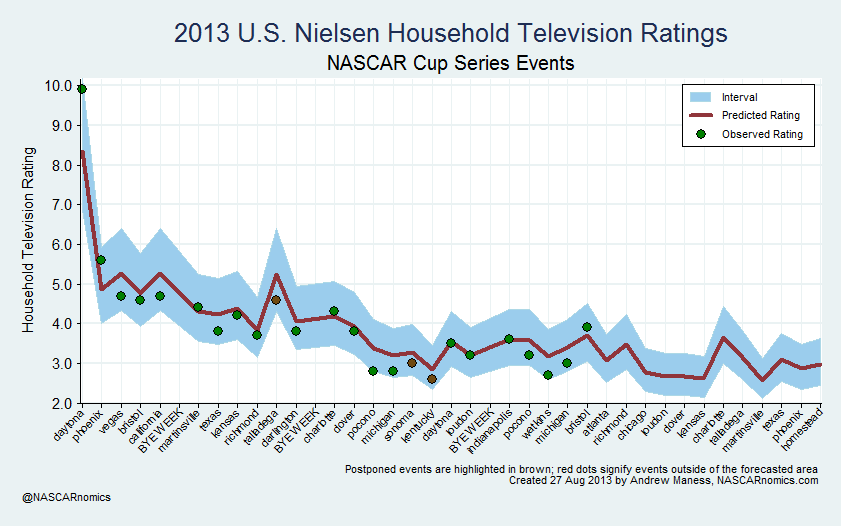 The maroon line estimates the predicted television for that race based off of historical trends. The dot is the actual television rating. It’s highlighted in green if the race nets an expected household audience, a brown mark if the race’s viewership is skewed by a weather delay, and a red dot if the event’s rating exceeds or falls short of the predicted value. NASCAR’s top series has performed consistently throughout 2013. Though there has been some worry about ESPN’s status for the balance of its NASCAR commitment, its ratings have fallen well within the “confidence interval” of historical expectations.
Finally, I glance at the long-term history of NASCAR’s ratings. The following chart plots the average television rating for the Cup Series from 1996 through 2013:
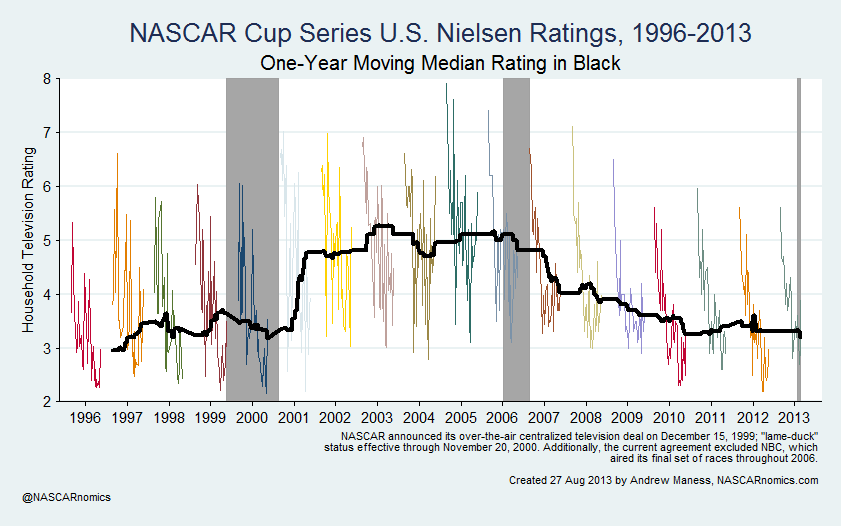 I shade three segments in gray. Each area represents races which were shown by networks with a definite end to their involvement with broadcasting NASCAR’s Cup Series. I’ll be watching to see if the current agreements with TNT and ESPN affect the median rating similarly to the previous “lame-duck” periods. Currently, the top series is enduring a three-year period of very high stability within its television ratings.
I’ll be back next week with some more in-depth research, but I figured that this would be a nice post to get you through the week. It was cool to meet some of you at the “tweet-up” at Bristol on Saturday. I hope to see some more of you in a couple of weeks at Richmond. And maybe Martinsville, too.